Operations | Monitoring | ITSM | DevOps | Cloud

Latest News

Flattened Datatype Mappings - Elasticsearch Tutorial

In this article, we’ll learn about the Elasticsearch flattened datatype which was introduced in order to better handle documents that contain a large or unknown number of fields. The lesson examples were formed within the context of a centralized logging solution, but the same principles generally apply. By default, Elasticsearch maps fields contained in documents automatically as they’re ingested.

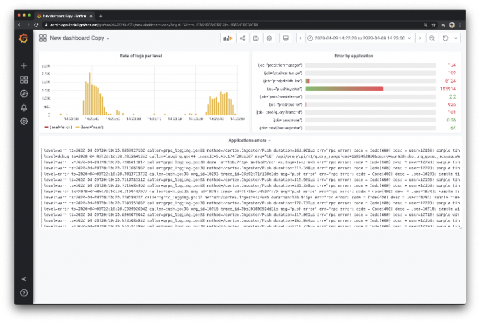
Getting Started with Grafana Dashboards using Coralogix

One of the most common dashboards for metric visualization and alerting is, of course, Grafana. In addition to logs, we use metrics to ensure the stability and operational observability of our product. This document will describe some basic Grafana operations you can perform with the Coralogix-Grafana integration. We will use a generic Coralogix Grafana dashboard that has statistics and information based on logs. It was built to be portable across accounts.

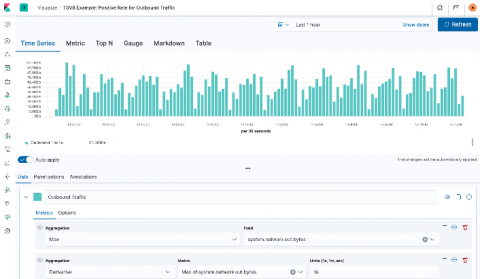
Visualizing observability with Kibana: Event rates and rate of change in TSVB

When working with observability data, a good portion of it comes in as time series data — things like CPU or memory utilization, network transfer, even application trace data. And the Elastic Stack offers powerful tools within Kibana for time series analysis, including TSVB (formerly Time Series Visual Builder). In this blog post, I’m going to attempt to demystify rates in TSVB by walking through three different types: positive rates, rate of change, and event rates.

How to design your Elasticsearch data storage architecture for scale

Elasticsearch allows you to store, search, and analyze large amounts of structured and unstructured data. This speed, scale, and flexibility makes the Elastic Stack a powerful solution for a wide variety of use cases, like system observability, security (threat hunting and prevention), enterprise search, and more. Because of this flexibility, effectively architecting your deployment’s data storage for scale is incredibly important.

Logz.io Infrastructure Monitoring: Configuring Alerts and Log-Metric Correlation

If you’ve followed our latest blog posts, you’ll have learned how to send metric data to Logz.io and visualize that data on Infrastructure Monitoring – our Grafana-based metrics monitoring solution that we made Generally Available on Monday. At this point you’ll have some nice looking Grafana dashboards in your account.

Generating MITRE ATT&CK® signals in Elastic SIEM: Sysmon data

Many mature security teams look to the MITRE ATT&CK® matrix to help improve their understanding of attacker tactics, techniques, and procedures (TTPs) and to better understand their own capabilities relative to these common adversarial approaches. With the release of Elastic Security 7.6, Elastic SIEM saw 92 detection rules for threat hunting and security analytics aligned to ATT&CK.

Stop the world, I want to get off. Oh! It stopped...

Sitting here in my home office reflecting the potential problems the world faces both in the short term and longer term, I can’t help but think back to my career before coming to Splunk. That time was spent on the ground working ‘in the real world’, maintaining the operational and security state of systems and networks. I can empathise with the huge pressures the entire IT chain from CIOs, CISOs, IT Managers and IT admins are under right now.

Loki quick tip: How to use a Loki datasource in your Grafana dashboard

In Grafana, Loki isn’t just for log visualization anymore. Now there’s a simple way to use a Loki datasource as a metric datasource in your graphs. This used to require a hack to make it work – adding Loki as a Prometheus datasource – and the process was very tedious. But Grafana v6.6 integrates Loki even better than before. As a result, right out of the box you can create very nice dashboards about your logs, and mix them with your dashboards about metrics.

Continuously manage your CircleCI implementation with Coralogix

For many companies today business success depends on quality efficient build, test and delivery processes. Development and deployment environments become complex very quickly, even for small and medium companies. A contributing factor to this complexity is companies’ adoption of microservices. This is where modern CI/CD solutions like CircleCI come in to help streamline these processes.

Logz.io Infrastructure Monitoring: Building Grafana Visualizations

Yesterday, my colleague Mike Elsmore wrote a blog about sending metrics to Logz.io Infrastructure monitoring – now let’s analyze them by building Grafana visualizations! Once you’ve started to send metric data to Logz.io, how do you visualize and interpret that data so that it’s useful for you? In Logz.io Infrastructure Monitoring, we use Grafana to provide dashboards and bring meaningful information to light.