Operations | Monitoring | ITSM | DevOps | Cloud

Latest News

Grafana EMEA meetup recap: shift left observability, AI and load testing, monitoring plants, and more

On Dec. 8, we gathered the Grafana EMEA community for another dynamic meetup. Experts from the Grafana Labs and k6 teams alongside observability pros from different organizations covered topics ranging from shift left observability practices to monitoring your green thumb at home with Grafana. In case you missed the virtual get together, here’s a recap of each talk along with the session videos.

Quarterly Product Update: Better Traces, CONCURRENCY, and RATE

At Honeycomb Developer Week, I got an opportunity to walk through a couple of fun new features we’ve shipped since August and ways that we’ve been able to improve Honeycomb for you. Hearing feedback from our users and customers— through support requests, in the Pollinators community, from Twitter, etc.—helps us make Honeycomb better for you.

ICYMI: Honeycomb Developer Week Wrap-Up

Getting started with observability can be time consuming. It takes time to configure your apps and practice to change the way you approach troubleshooting. So it can be hard to prioritize investing time, especially if you can’t clearly see how that investment will pay off. That’s why we put together Honeycomb Developer Week: short, snackable, time-efficient learning sessions to jumpstart your observability journey.

What is the Purpose of Observability? In a Word, Innovation

Asking an IT engineer or SRE to define the purpose of observability is kind of like asking someone to explain the purpose of life: There are lots of different opinions out there, and no way of proving any of them right or wrong. You could argue that observability is just a buzzword that refers to what used to be called monitoring.

Introducing the Sensu pipeline resource

Sensu’s observability pipeline includes resources for collecting, filtering, transforming, and processing observability data: checks, event filters, mutators, and handlers. These resources and Sensu’s observability pipeline concept are well seasoned and widely used at thousands of companies. However, configuration can be somewhat unintuitive, especially for new users.

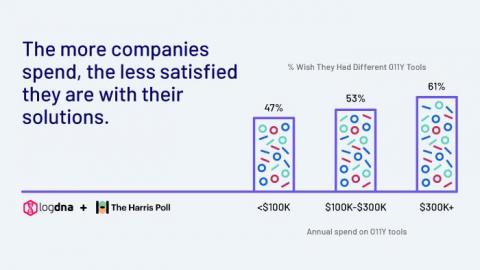
The 2022 State of Observability Report

Interest in observability is at an all-time high. When we attended KubeCon in Los Angeles in October, observability and security were everywhere—in conversations with attendees and other vendors, during sessions, and in messaging at booths—indicating that there’s still an unmet need. In fact, Gartner declared that observability is at the ‘peak of inflated expectations' in a recent Hype Cycle report.

HoneyByte: Using Application Metrics With Prometheus Clients

Have you ever deep dived into the sea of your tracing data, but wanted additional context around your underlying system? For instance, it may be easy to see when/where certain users are experiencing latency, but what if you needed to know what garbage collection is mucking up the place or which allocated memory is taking a beating? Imagine having a complete visual on how an application is performing when you need it, without having to manually dig through logs and multiple UI screens.