Operations | Monitoring | ITSM | DevOps | Cloud
Latest News
Observability into Your FinOps: Taking Distributed Tracing Beyond Monitoring
Distributed tracing has been growing in popularity as a primary tool for investigating performance issues in microservices systems. Our recent DevOps Pulse survey shows a 38% increase year-over-year in organizations’ tracing use. Furthermore, 64% of those respondents who are not yet using tracing indicated plans to adopt it in the next two years. However, many organizations have yet to realize just how much potential distributed tracing holds.
Observability - An Ultimate Guide
A developers perspective is different. While managing various sectors in a software, sometimes it would be difficult to monitor the activities and identify the bug that is disrupting the functions. What if you can spot the error beforehand, and resolve it at the earliest? The strategies that we focus on, and implement are the ones that help us effectively manage our tasks. That is possible by knowing about Observability. Let's learn in detail about it through this blog. TABLE OF CONTENTS.
Serverless Observability: It's easier than you think!
Observability is a measure of how well the internal state of a system can be inferred from its external outputs. It helps us understand what is happening in our application and troubleshoot problems when they arise. It’s an essential part of running production workloads and providing a reliable service that attracts and retains satisfied customers.
Incident Resolution: Do You Remember, the Twenty Fires of September?
From September to early October, Honeycomb declared five public incidents. Internally, the whole month was part of a broader operational burden, where over 20 different issues interrupted normal work. A fraction of them had noticeable public impact, but most of the operational work was invisible. Because we’re all about helping everyone learn from our experiences, we decided to share the behind-the-scenes look of what happened.
Introducing Grafana Enterprise Traces, joining metrics and logs in the Grafana Enterprise Stack observability solution
Today, we are launching a new Grafana Labs product, Grafana Enterprise Traces. Powered by Grafana Tempo, our open source distributed tracing backend,.and built by the maintainers of the project, this offering is an exciting addition to our growing self-managed observability stack tailored for enterprises.
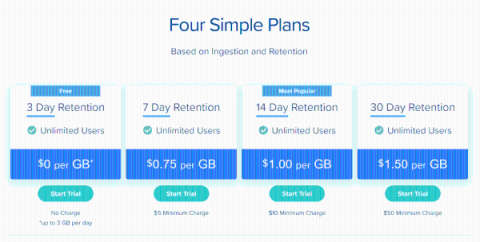
What's Wrong With Observability Pricing?
There’s something wrong with the pricing of observability services. Not just because it costs a lot – it certainly does – but also because it’s almost impossible to discern, in many cases, exactly how the costs are calculated. The service itself, the number of users, the number of sources, the analytics, the retention period, and extended data retention, and the engineers on staff who maintain the whole system are all relevant factors that feed into the final expense.
Game Launches Should Be Exciting for Your Players, Not for Your LiveOps Team
The moment of launching something new at a game studio (titles, experiences, features, subscriptions) is a blockbuster moment that hangs in the balance. The architecture—distributed and complex, designed by a multitude of teams, to be played across a variety of devices in every corner of the world—is about to meet a frenzy of audience anticipation, along with the sky-high expectations of players, executives, and investors.
Observability in Practice
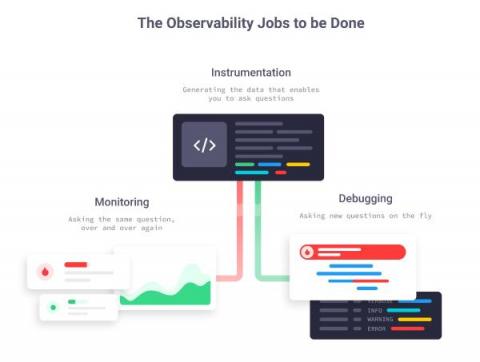
After years of helping developers monitor and debug their production systems, we couldn’t help but notice a pattern across many of them: they roughly know that metrics and traces should help them get the answers they need, but they are unfamiliar with how metrics and traces work, and how they fit into the bigger observability world. This post is an introduction to how we see observability in practice, and a loose roadmap for exploring observability concepts in the posts to come.
Mario vs. Steve: What Video Games Can Teach Us about Monitoring vs. Observability
Credit: Unsplash What is monitoring? What is observability? Monitoring shows you how a Kubernetes environment and all of its layers are operating. Observability, on the other hand, is a measure of how well internal states of a system can be inferred from knowledge of its external outputs.


