Operations | Monitoring | ITSM | DevOps | Cloud
Latest News
Discovering the Differences Between Log Observability and Monitoring
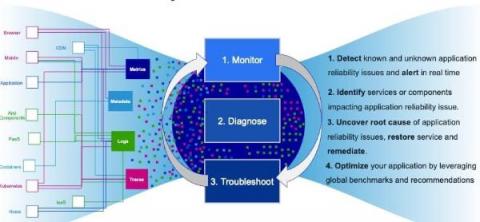
Log observability and monitoring are terms often used interchangeably, but really they describe two approaches to solving and understanding different things. Observability refers to the ability to understand the state of a complex system (or series of systems) without needing to make any changes or deploy new code.
Tucker Callaway on the State of the Observability Market
Tucker Callaway is the CEO of LogDNA. He has more than 20 years of experience in enterprise software with an emphasis on developer and DevOps tools. Tucker drives innovation, experimentation, and a culture of collaboration at LogDNA, three ingredients that are essential for the type of growth that we've experienced over the last few years.
5 Examples of Metrics or Log Data That Drives Observability
Which data sources do DevOps teams need in order to achieve observability? At a high level, that’s an easy question to answer. Concepts like the “three pillars of observability”—logs, metrics, and traces—may come to mind. Or, you may think in terms of techniques like the RED Method or Google’s Golden Signals, which are other popular frameworks for defining which types of data teams should collect for monitoring and observability purposes.
The Magic of Metrics-and How It Can Burn You
As product developers, our responsibility continues beyond shipping code. To keep our software running, we need to notice whether it’s working in production. To make our product smoother and more reliable, we need to understand how it’s working in production. We can do this by making the software tell us what we need to know. How can we notice when the software is running smoothly? Make it tell us!
How Time Series Databases Work-and Where They Don't
In my previous post, we explored why Honeycomb is implemented as a distributed column store. Just as interesting to consider, though, is why Honeycomb is not implemented in other ways. So in this post, we’re going to dive into the topic of time series databases (TSDBs) and why Honeycomb couldn’t be limited to a TSDB implementation. If you’ve used a traditional metrics dashboard, you’ve used a time series database.
Illuminate 2021 - Embracing open standards for big picture observability
Understanding the Three Pillars of Observability
Observability and its implementation may look different to different people. But, underneath all the varying definitions is a single, clear concept: Most software that’s run today uses microservices or loosely coupled distributed architecture. While this design makes scaling and managing your system more straightforward, it can make troubleshooting issues more difficult. The three pillars of observability are different methods to track software systems, especially microservices.
Rethinking observability for Kubernetes
Observability is a staple of high-performing software and DevOps teams. Research shows that a comprehensive observability solution, along with a number of other technical practices, positively contributes to continuous delivery and service uptime.
Honeycomb Differentiators Series: SLOs That Tell the Whole Story
In the recent past, most engineering teams had a vague notion of what Service Level Agreements (SLAs) and Service Level Objectives (SLOs) were—mainly things that their more business-focused colleagues talked about at length during contract negotiations. The success or failure of SLAs were tallied via magic calculations (what is “available” anyway?!) at the end of the month or quarter, and adjustments were made in the form of credits or celebrations in the break room.


