Operations | Monitoring | ITSM | DevOps | Cloud

Latest News

No more searching for a needle in a haystack: A world where Elastic & StackState team up

Meeting the goal of delivering great performance and reliability in the face of our ever-changing, increasingly autonomous IT environments is fundamentally challenged by a data problem. Sure, there’s lots of it - logs, metrics, and APM traces - but it is exceedingly hard to extract actionable information when there are so many fast moving parts.

De Watergroep and Devoteam build Elastic Observability pipeline to deliver water to millions

De Watergroep is responsible for the supply of water to more than 3 million customers and hundreds of companies in Belgium. An organisation operating in the public sector, De Watergroep's main goal is to continuously ensure the availability of high-quality drinking water. De Watergroep also is constantly engaged in technological innovation, focusing on keeping distribution costs low, and making maintenance more cost efficient.

Metrics now generally available in Honeycomb

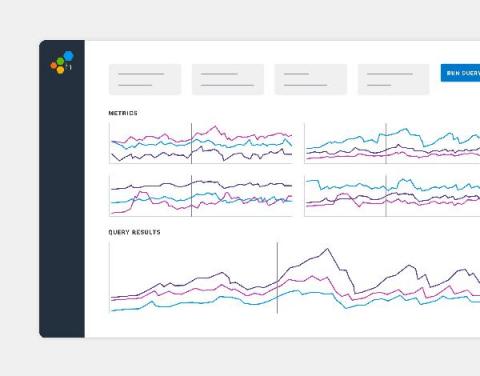
Starting today, Honeycomb Metrics is now generally available to all Enterprise customers. You’ve adopted our event-based observability practices, in part to overcome the debugging roadblocks you hit when using custom metrics to identify application issues. But metrics do still provide value at the systems level. Now, you can easily see and use your metrics data alongside your event data in Honeycomb—all in one interface.

Tracing AWS Lambdas with OpenTelemetry and Elastic Observability

Open Telemetry represents an effort to combine distributed tracing, metrics and logging into a single set of system components and language-specific libraries. Recently, OpenTelemetry became a CNCF incubating project, but it already enjoys quite a significant community and vendor support. OpenTelemetry defines itself as “an observability framework for cloud-native software”, although it should be able to cover more than what we know as “cloud-native software”.

An Introduction to Distributed Tracing

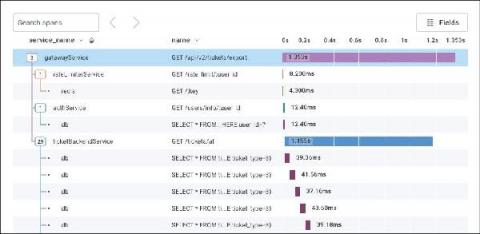
There’s no strict definition of a distributed system. But generally speaking, if you have reached a point where you’re running more than five interdependent services at once, that means you’re running a distributed system. It also means you are more than likely experiencing difficulties when troubleshooting using traditional debugging tools. Unfortunately, pulling up multiple tools, each built for a monolithic world, doesn’t help pinpoint the problem.

Serverless observability and real-time debugging with Dashbird

Systems run into problems all the time. To keep things running smoothly, we need to have an error monitoring and logging system to help us discover and resolve whatever issue that may arise as soon as possible. The bigger the system the more challenging it becomes to monitor it and pinpoint the issue. And with serverless systems with 100s of services running concurrently, monitoring and troubleshooting are even more challenging tasks.

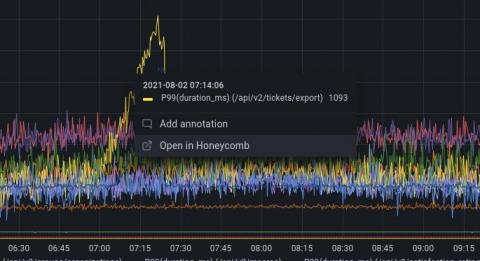
Introducing the Honeycomb plugin for Grafana

Over the years, we’ve heard many versions of the same familiar story: large businesses struggling with observability data living in several different systems. At Grafana Labs, our “big tent” philosophy is based on the belief that our users should determine their own observability strategy and choose their own tools. Grafana allows them to bring together and understand all their data, no matter where it lives.

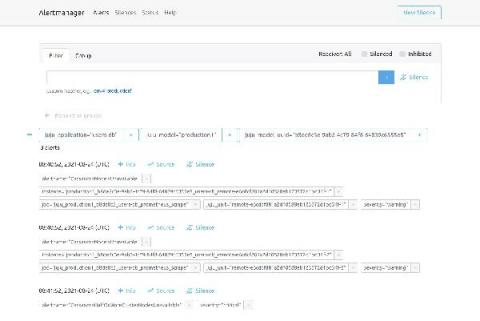
Model-driven observability: Taming alert storms

In the first post of this series, we covered the general idea and benefits of model-driven observability with Juju. In the second post, we dived into the Juju topology and its benefits with respect to entity stability and metrics continuity. In this post, we discuss how the Juju topology enables grouping and management of alerts, helps prevent alert storms, and how that relates with SRE practices.