Operations | Monitoring | ITSM | DevOps | Cloud
Latest News
Quarterly Product Update: Management API, Query Builder, SLOs, and Metrics
Your feedback is what makes Honeycomb better. We ship changes often (you can see updates in real time on our changelog), so it can be easy to miss some of the new improvements that can help you get the most out of Honeycomb. Whether it’s a big new product feature or an enhancement of existing features, you may not always be up on the latest goodness waiting for you in Honeycomb.
Contextual Intelligence and Observability: Without the Former, You Really Don't Have the Latter
Observability is a hot term in the industry, but don’t let it fool you: having visibility into your organization's apps and services only gives you partial clarity into a system’s overall performance. To get a full understanding of your monitoring data, you need to apply contextual intelligence.
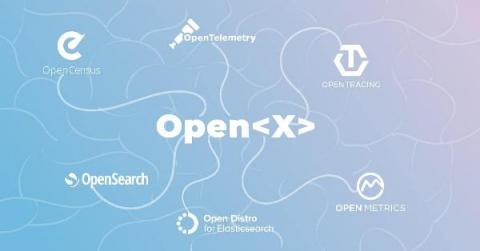
Quick Dictionary to Open<X> Projects in Observability
Do you also find yourself confused by all the Open-this and Open-that names flying around? There are currently a good few Open projects, standards, tools – OpenTelemetry, OpenTracing, OpenCensus, OpenSearch… heck, even my podcast is called OpenObservability! And new Open names seem to be popping up every other day. If you too feel this way, there’s no need. Many feel similarly confused.
Model-driven observability: modern monitoring with Juju
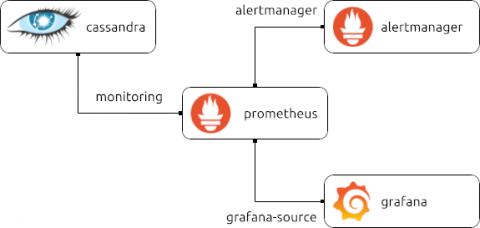
The end-to-end monitoring of complex software systems is difficult, toil-intensive and error-prone. Developers, SREs and Platform teams must continuously invest effort in setting up and maintaining the monitoring setups that underpin the observability of their systems, or accept the risk of being unaware of ongoing issues and their impact on end users. Enter model-driven observability powered by Juju!
Tale of the Beagle (Or It Doesn't Scale-Except When It Does)
If there’s one thing folks working in internet services love saying, it’s: "Yeah, sure, but that won’t scale." It’s an easy complaint to make, but in this post, we’ll walk through building a service using an approach that doesn’t scale in order to learn more about the problem. (And in the process, discovering that it actually did scale much longer than one would expect.)
How Vanguard used Observability to Accelerate and De-risk their Cloud Migration
Rich Anakor, chief solutions architect at Vanguard, is on a small team with a big goal: Give Vanguard customers a better experience by enabling internal engineering teams to better understand their massively complex production environment—and to do that quickly across the entire organization, in the notoriously slow-moving financial services industry. They also had a big problem: The production environment itself.
What's the Difference between Observability and Monitoring?
Observability with Zero Code Instrumentation? Meet eBPF
Current observability practice is largely based on manual instrumentation, which requires adding code in relevant points in the user’s business logic code to generate telemetry data. This can become quite burdensome and create a barrier to entry for many wishing to implement observability in their environment. This is especially true in Kubernetes environments and microservices architecture.
Improving Our Typography to Optimize the Honeycomb User Experience
This is the second post in our series about Lattice, Honeycomb’s new design system and how we’re applying a user-centric design philosophy to our product. Lattice begin! At Honeycomb, we understand that our users are often under a great deal of pressure when troubleshooting complicated issues in their applications.


