Operations | Monitoring | ITSM | DevOps | Cloud

Latest News

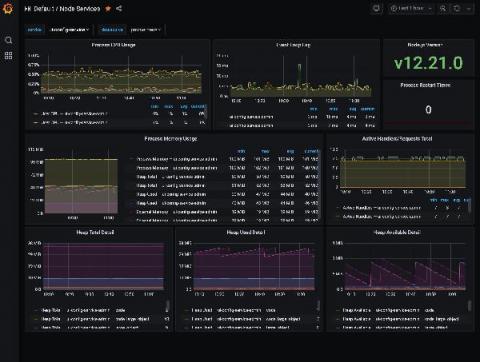
How PayIt, a secure cloud service provider for digital government, uses Grafana and Prometheus for observability at cloud native scale

A trip to the DMV — and a realization that there had to be a better, more modern way for the system to work — sparked the idea for PayIt, a secure cloud service provider for digital government that launched in 2013. The company’s mission is to help state, local, and government agencies reach their constituents better and more effectively, shifting the reliance from in-office payments to digital ones.

The State of Observability 2021: Key Findings

We at VMware Tanzu recently published our first-ever summary of the current state of observability. The main goal of our research was to uncover the key trends in observability adoption by hearing directly from IT practitioners, including DevOps teams, SREs, application architects, and their managers. We also wanted to understand what’s driving the popularity of observability and what the organizational impact of deploying observability is.

Monitoring AWS EC2 with Splunk Observability

Today, much of our online world is powered by cloud computing, and Amazon Web Services offers an amazing depth and breadth of available services. However, most of the time it starts with Amazon Elastic Compute Cloud, EC2. EC2 is powered by virtual servers called instances and allows users to provision scalable compute capacity as desired. This means no server hardware investment and the ability to scale up or down in response to demand (thus elastic).

Getting started with free and open Elastic Observability

Unify and contextualize your logs, metrics, application trace data, and availability data behind a single pane of glass. Elastic Observability provides a unified view into the health and performance of your entire digital ecosystem. With easy ingest of multiple kinds of data via pre-built collectors for hundreds of data sources, Elastic Observability delivers seamless integration between the facets of observability.

Logz.io Named a Leader in GigaOm Radar for Cloud Observability

Today we are excited to share a key milestone, not only for Logz.io, but also for our industry as a whole. For the first time ever, an industry analyst took on the ambitious challenge of analyzing and assessing several different markets including monitoring and telemetry, APM, AIOps, observability, and more. The radar also takes account of evaluating leaders’ various products, unveiling a comprehensive overview under the unified lens of Observability.

Announcing Lightrun Cloud: Shifting Left Observability, One Developer at a Time

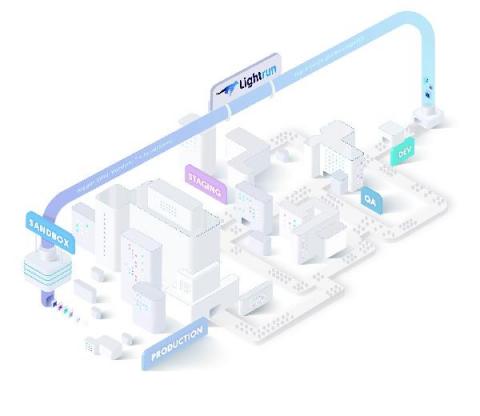
We’re proud to announce the general availability of Lightrun Cloud – a completely free and self-service version of the Lightrun platform. We consider Lightrun Cloud to be a major milestone in our constant journey to empower developers with better observability tooling and welcome you to sign up for a free account.

Announcing New Honeycomb Management API

Starting today, Honeycomb’s Management API is generally available to all Honeycomb users. The Honeycomb Management API is a set of endpoints that lets you programmatically set up, configure, and delete queries, datasets, derived columns, and more. With this release, you can now manage Honeycomb with configuration as code either directly via API or with third-party tools, like Terraform, using the community-contributed Honeycomb provider.