Operations | Monitoring | ITSM | DevOps | Cloud

Latest News

Microservices Without Observability Is Madness

As I said before, Speed is King. Business requirements for applications and architecture change all the time, driven by changes in customer needs, competition, and innovation and this only seems to be accelerating. Application developers must not be the blocker to business. We need business changes at the speed of life, not at the speed of software development.

Node.js Security and Observability using Lightrun & Snyk

As developers, we spend a lot of time in our IDEs writing new code, refactoring code, adding tests, fixing bugs and more. And in recent years, IDEs have become powerful tools, helping us developers with anything from interacting with HTTP requests to generally boosting our productivity. So you have to ask — what if we could also prevent security issues in our code before we ship it?

What Is Honeycomb's ROI? Forrester's Study on the Benefits of Observability

Register for the webinar and download the full study to see and apply Forrester’s financial model to determine the observability ROI for your organization. Many teams want to adopt observability and Honeycomb—but run into budget roadblocks because budget holders may not clearly understand the quantifiable benefits to their end users, their teams, and the bottom line.

The Essential Guide to Kubernetes Service Discovery

A fundamental element of the Kubernetes microservices system is the services model, which gives teams greater understanding of how their applications are deployed. These objects running within pods and containers, by extension, are RESTful since they’re based on APIs. However, DevOps teams can’t hope to run a tight ship without managing their services. Communication and visibility are absolutely crucial in a Kubernetes system.

Model-driven observability: the magic of Juju topology for metrics

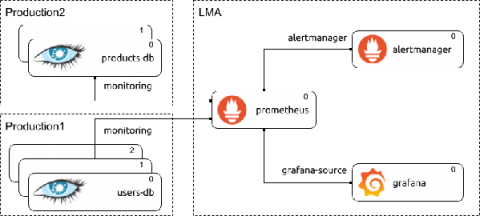
In the first post of this series, we covered the general idea and benefits of model-driven observability with Juju, but did not dive deep into the idea of contextualization and how it makes observability more actionable. In this post we start addressing what contextualization means in model-driven observability, starting from adding Juju topology metadata added to telemetry, and how that improves the processing and querying the telemetry for charmed applications.

How an observability consulting company solved a client's monitoring issues with Grafana Cloud

Companies are always looking for transparency and visibility when it comes to monitoring, but as monitoring requirements and methods evolve, it’s not always easy to keep up. That’s why Opsdis, an observability consulting company based in Göteborg, Sweden, was founded. The firm focuses solely on helping clients implement systems for monitoring and metrics so they can keep up with the ever-expanding world of cloud computing and containerized environments.

So much data, so little time: How your observability tool can help teams make better use of data

Digital transformations can entail significant shifts in technology, such as migrating from on-site architecture to cloud services, and these complex transformations generate massive amounts of data. Data transparency is a must-have, and observability with AIOps delivers the solution. Through a unified view of data, AIOps guides DevOps and SRE teams through the swamp of information

Full-cycle observability with the Elastic Stack and Lightrun

An application running in production is a difficult beast to tame. Most experienced developers–ones who spent enough late nights or Saturday mornings trying to break apart a nasty production bug–will try and create the clearest possible picture for their later selves while writing their code, so that they could understand what’s actually going on in the system during an incident.

Honeycomb Is All-In on OpenTelemetry

OpenTelemetry (or “OTel”) helps you get your instrumentation started quickly, and it helps you get the most out of that telemetry data by providing flexible exporting options. As a result, it’s emerging as the new standard for instrumentation. To that end, today we’re sharing more insight into the work we’ve done (and are doing) to enable a path for all Honeycomb users toward OTel adoption. We hope you’ll be as excited as we are to embrace these open standards!

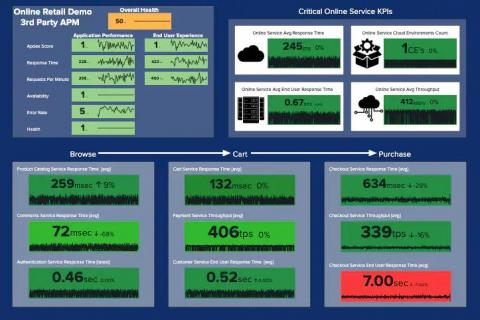
3rd Party APM: Unite Your Legacy APM Data on Your Journey to Observability!

Today you likely have one or more legacy APM (Application Performance Monitoring) solutions. You are moving from a monolithic architecture to microservices, and you are accelerating your journey to Cloud, and you need to deliver at speed with scale and quality to your customers. Sadly, visibility into these results are limited to each of these solutions and their interfaces.