Operations | Monitoring | ITSM | DevOps | Cloud

Latest News

Real User Monitoring With a Splash of OpenTelemetry

You're probably familiar with the concept of real user monitoring (RUM) and how it's used to monitor websites or mobile applications. If not, here's the short version: RUM requires telemetry data, which is generated by an SDK that you import into your web or mobile application. These SDKs then hook into the JS runtime, the browser itself, or various system APIs in order to measure performance.

What is Network Observability (vs. Network Monitoring)?

Today, we embark on an exciting journey into the realm of network observability, where the world of network monitoring gets a vibrant makeover. While network monitoring has long been the stalwart guardian of network operations, network observability swoops in like a caped hero, adding a whole new level of awesomeness to the game.

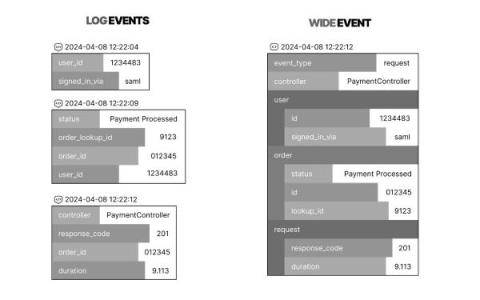
Observable systems with wide events

Oh, I didn't see you there. Hi, I'm Kevin, a developer here at Honeybadger. I've worked for the last year or so developing Honeybadger Insights, our new logging and observability platform. Let's peek into some of the design decisions and philosophy behind the product. In modern software development, the hunt for observable systems has traditionally revolved around the holy trinity of logs, metrics, and traces.

Cisco Full-Stack Observability named a Leader in GigaOm Radar for Cloud Observability

The results are in! Learn why Cisco Full-Stack Observability was recognized as a Leader in GigaOm Radar for Cloud Observability in 2024. I’m pleased to announce that Cisco Full-Stack Observability was recently recognized as a Leader in the 2024 GigaOm Radar for Cloud Observability.

Mastering Live Debugging Techniques: A Must-Have Guide for Developers

Software debugging has undergone many transcendental shifts. These shifts are as fascinating as the transition from the biological origins of the term ‘debugging’ to its computer science incarnation. The moth that caused the first computer bug has led to a metamorphosis of the debugging scope to cover a much broader role in software development over the years. Live debugging is the latest manifestation of this evolution.

Transforming to an Engineering Culture of Curiosity With a Modern Observability 2.0 Solution

Relying on their traditional observability 1.0 tool, Pax8 faced hurdles in fostering a culture of ownership and curiosity due to user-based pricing limitations and an impending steep price increase. Pax8’s platform engineering team was keen on modernizing the company’s cloud commerce platform, but they were hitting obstacles with their traditional observability 1.0 tool, which relied on the three pillars of logs, metrics, and traces.

Introduction to Observability

These days, systems and applications evolve at a rapid pace. This makes analyzing the internal performance of applications complex. Observability emerges as a path to efficient and effective operational insights. Imagine a team of doctors monitoring a patient’s vitals—heart rate, temperature, blood pressure. These readings, combined with observation of symptoms, paint a picture of the patient’s health. This allows doctors to diagnose issues and provide care.

Google Cloud Welcomes Full-Stack Observability with StackState

When Google Cloud welcomed StackState to offer our full-stack observability solution to their network of customers, we were thrilled. Our excitement only grew when Google invited us to join other partners this week at Google Cloud Next ’24 at the Mandalay Bay Convention Center in Las Vegas.

Selector Wins 2024 Data Breakthrough Award for Data Observability Innovation

Selector has received the 2024 Data Breakthrough Award for Data Observability Innovation of the Year in the Data Management category! This accomplishment marks the second year Selector has received a Data Breakthrough Award, winning Best AIOps Platform in 2023. In this post, learn more about this award and how it reflects our unique approach to data observability.