Operations | Monitoring | ITSM | DevOps | Cloud

Latest News

InfluxDB 3: Fully Available for the Future of Time Series

Today, we are announcing the public alpha of the newest additions to the InfluxDB 3 time series database product line: InfluxDB 3 Core, our latest open source product, and InfluxDB 3 Enterprise, a commercial version built on Core that provides enhanced functionality for enterprise-scale applications.

InfluxDB 3 Open Source Now in Public Alpha Under MIT/Apache 2 License

New InfluxDB 3 Core and InfluxDB 3 Enterprise products now available for alpha testing. Today we’re excited to announce the alpha release of InfluxDB 3 Core (download), the new open source product in the InfluxDB 3 product line along with InfluxDB 3 Enterprise (download), a commercial version that builds on Core’s foundation. InfluxDB 3 Core is a recent-data engine for time series and event data.

How to Use Service Level Objectives (SLOs) in Your IT Monitoring

With countless companies delivering their services digitally, reliability and performance are more important than ever. Whether you want to keep your website running 24/7 or ensure your application is responsive to user actions, you need a dependable way to measure your services’ performance and ensure they meet your requirements and those of your customers. Central to this is SLO (Service Level Objective). SLOs are targets that outline the expected performance of a particular service.

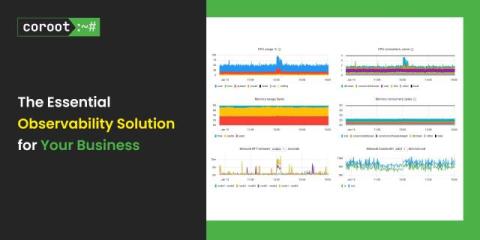
Essential Observability with Coroot

There is a phenomenal amount of Observability tools on the market, coming in all shapes and sizes, offering many tools and approaches to solve what seems to be an endless number of problems. It also can be overwhelming to use, hard to set up and expensive to run, especially if you are going with SaaS based market leaders like DataDog.

Unified Web Performance: Real User Monitoring and Lab Testing

At Request Metrics, we’re always looking for ways to help you make your websites faster and your users happier. Today, we’re excited to announce a major new capability: Unified Performance Monitoring. Request Metrics now combines the power of real-user monitoring with automated lab performance testing to get a complete picture of your website’s performance.

Detecting and Resolving Broken Links Using Website Monitoring Software

Broken links are more than minor annoyances—they can significantly harm your website’s user experience, SEO rankings, and overall credibility. Whether managing a small blog or a complex e-commerce platform, ensuring that your site functions flawlessly is essential to keeping visitors engaged and search engines satisfied. However, identifying and fixing broken links manually can be time-consuming and error-prone. That’s where website monitoring software comes into play.

Your First Year with DEX: A Strong Approach

When it comes to Digital Employee Experience (DEX), the key to success is treating it as a journey, not a destination. Organizations need to deliver outcomes and value quickly, while simultaneously building the maturity of their DEX initiatives over time. The journey involves deliberate planning, with clearly defined milestones and goals along the way.

Key metrics for Kubernetes performance monitoring: A practical guide

Kubernetes is known to be the best container orchestration tool, but it can also add complexity to resource management, particularly as your clusters expand. Without proper monitoring, problems can rapidly worsen, resulting in subpar application performance, service interruptions, and higher expenses. In this blog, you will learn the key metrics for monitoring Kubernetes performance and how monitoring these can assist you in maintaining optimal performance in your environment.

Real-Time IT Insights: How Commvault Fined-Tuned Microsoft-Centric Monitoring with VirtualMetric

Managing a complex IT environment with both on-premises data centers and multiple cloud platforms (Azure, AWS, Google Cloud) brings a unique set of challenges. Commvault’s cloud operations team, led by Ernie Costa, was well aware of the high-performance systems running on technologies like Hyper-V and NVMe storage. In these systems, even a second’s delay could mean missed opportunities to prevent incidents or optimize performance.