Operations | Monitoring | ITSM | DevOps | Cloud

Latest News

Request Metrics and Perforator - Combining RUM and Load Testing

Your website’s performance can make or break your business. Slow load times, crashes under pressure, and a poor user experience can cost you customers, reduce your search engine rankings, and hurt your bottom line. That’s why monitoring and testing your site’s performance is critical—but not all performance monitoring is the same. At Request Metrics, we focus on Real User Monitoring (RUM), which shows you how real users are experiencing your website in real-time.

State of Observability 2024 reveals how leaders outpace their peers

Discover how leaders in IT operations and engineering outperform peers through advanced observability practices. The State of Observability 2024 report reveals insights on AI, OpenTelemetry, platform engineering, and cutting-edge strategies driving innovation, efficiency, and competitive advantage. This article originally appeared on Splunk.com. In 2024, simply having an observability practice is a given. In this era of observability, a high-functioning team will set leaders apart from their peers.

Monitoring Azure AKS & Azure Linux with VictoriaMetrics

Azure linux is a Linux distribution built for Microsoft’s cloud infrastructure. It can be used as a base OS when creating node pools in Azure Kubernetes Service (AKS) clusters. Using Azure linux as a base OS for AKS node pools has several benefits, such as lower resources footprint, faster boot times, and better security.

Exploring C# 11 Features: What's New and How to Use It

C# has been a popular programming language for many years now. It continuously evolves to include new features and adopt recent trends. Its flexibility makes it a language ideal for many different domains and platforms like desktop applications, enterprise systems, web development, games, cross-platform, and native mobile applications. Back when Microsoft launched.NET 7, this also included a new version of C# with version number 11.

Reduce Observability Costs with OpenTelemetry Setup

Maintaining and visualizing telemetry data efficiently is super important for DevOps and SecOps teams. OpenTelemetry, a fantastic open-source observability framework, can really help with this without being too costly. Picture having a simple process that improves your data and helps your team make smart decisions without spending too much money. Let's chat about some budget-friendly ways to set up OpenTelemetry agents.

Entra ID Security Monitoring

The whitepaper delves into how effective monitoring of identity access and authentication can enhance security, improve compliance, and mitigate potential threats. By examining key metrics, best practices, and real-time monitoring strategies, this whitepaper demonstrates how Microsoft Entra ID monitoring can proactively safeguard IT infrastructures, detect suspicious activity, and streamline access management for hybrid environments.

Gaining End-to-End Network Observability in a Multi-Cloud World

In a relatively short period of time, networks have grown much bigger, much more complex, and much more critical to the ongoing operation of the business. Quite simply, while ensuring optimized network services has never been more critical, it’s also never been more difficult. In many large enterprises, network operations teams are seeing tens of thousands of endpoints added to already complex internal environments.

Comprehensive Guide to Dotcom-Monitor's DNS Monitoring Solution

In today’s digital world, a business’s online success relies heavily on a strong infrastructure. At the heart of that infrastructure is DNS (Domain Name System). Without DNS, the internet as we know it simply wouldn’t work.. Given its vital role, any issue with DNS can lead to serious problems for a business. Things like website downtime, sluggish performance, or even security breaches are just a few of the risks that arise when DNS servers fail.

BT Ireland Reduced Alarm Noise with DX NetOps: Here's How

For today’s enterprises, there’s no good time for network downtime. In this post, we detail how DX NetOps by Broadcom provides advanced capabilities that help teams minimize outage incidents and duration. We then offer an example of how these capabilities benefited a leading telecommunications provider in the UK, fueling an 80% reduction in alarm noise and a 40% decrease in mean time to resolution.

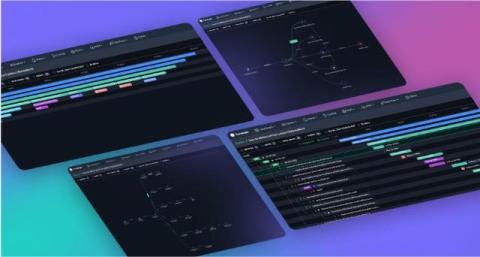
Master debugging with four ways to visualize your traces

In a world where microservices rule and distributed architectures are the norm, understanding how a single request flows through your system can be an overwhelming challenge. But don’t worry—there’s light at the end of the tunnel! And not just one light, but four.