Operations | Monitoring | ITSM | DevOps | Cloud

Latest News

Top 7 Dynatrace Competitors and Alternatives In 2024

Application Performance Monitoring (APM) tools play a critical role in ensuring seamless user experiences for businesses. While Dynatrace has established itself as a leader in this field, there exists a range of alternative solutions in the market that may align more closely with the specific needs of your organization. This comprehensive guide delves into the diverse competitors of Dynatrace, offering valuable insights to empower you in making a well-considered choice when procuring an APM solution.

Monitor your generative AI app with the AI Observability solution in Grafana Cloud

Generative AI has emerged as a powerful force for synthesizing new content—text, images, even music—with astounding proficiency. However, monitoring, optimizing, and maintaining the health of these complex AI systems is challenging, and traditional observability tools are struggling to keep pace. At Grafana Labs, we believe that every data point tells a story, and every story needs a capable narrator.

Monitoring and Troubleshooting Nerdio

Today I’ll give a brief overview on monitoring and troubleshooting Nerdio, a.NET application, popular with MSPs (Managed Service Providers) and enterprises using Microsoft Azure Virtual Desktop (AVD). Nerdio is a cloud-based application used by administrators to automate the deployment and management of virtual desktops in Azure.

Mastering Enterprise Network Complexity with Advanced Visualization Techniques

The landscape of enterprise networking has undergone tremendous change in recent years. Widespread adoption of software-defined networking (SDN), the proliferation of multi-cloud environments, the rise of edge computing, and the implementation of zero-trust security models have collectively reshaped network architectures. While these trends bring unprecedented flexibility and scalability, they have also exponentially increased complexity.

Objectively Gauging User Experience with Apdex and AppNeta

In today’s digital environments, slow is the new down. As users continue to grow increasingly accustomed to rapid response—and less willing to wait—slow application performance continues to be highly problematic for organizations. While downtime of major services can make headlines, it is more often slow performance that hurts businesses, ultimately stifling productivity and profits.

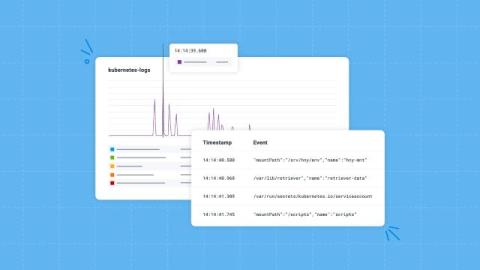
Debugging Kubernetes Autoscaling with Honeycomb Log Analytics

Let’s be real, we’ve never been huge fans of conventional unstructured logs at Honeycomb. From the very start, we’ve emitted from our own codestructured wide events and distributed traces with well-formed schemas. Fortunately (because it avoids reinventing the wheel) and unfortunately (because it doesn’t adhere to our standards for observability) for us, not all the software we run is written by us.

Accelerate Visibility and Analysis With New Cribl Search Packs

Our new Cribl Search Packs give you a framework for packaging, sharing, and installing config bundles that align with a given data source or use case. Similar in concept to our original Cribl Stream Packs framework, Cribl Search Packs help users find value in their datasets more quickly across common use cases. In fact, Stream Pack users were a powerful driver in the development of Search Packs.

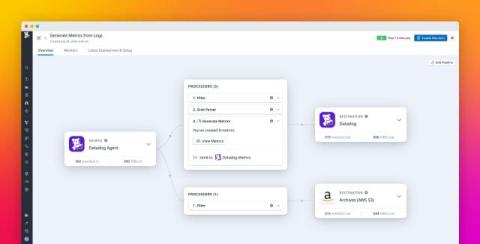
Generate metrics from your high-volume logs with Datadog Observability Pipelines

Logs are a rich source of information, providing you with the minute details you need to troubleshoot a specific issue or perform extensive historical analysis. But with billions of logs being generated from your infrastructure every day, it isn’t practical to sift through them all to derive actionable insights. Firewall, CDN, network activity, and load balancer logs are especially high volume, requiring storage solutions that can be expensive and difficult to scale.

The Role of External Service Monitoring in SRE Practices

Modern businesses rely on a variety of external services to support their operations, including APIs, cloud platforms, CDNs, payment gateways, and more. Whether it's pulling data from an external API, using a cloud service for storage, or integrating a third-party tool for analytics, these services help achieve many business objectives. Given their criticality, it’s important to have a reliable mechanism for monitoring external services.

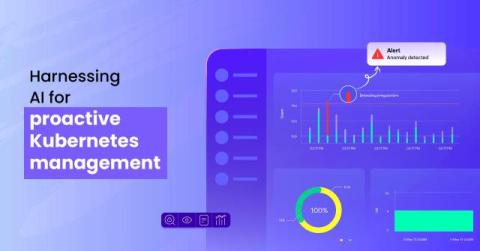
The role of AI in Kubernetes monitoring

In a dynamic environment like Kubernetes, where manual tracking is impossible, AI-powered monitoring tools, such as Site24x7, surf through enormous amounts of data, detecting irregularities, predicting vulnerabilities, and alerting the user about a possible outage that is about to happen if the resource is not handled.