Operations | Monitoring | ITSM | DevOps | Cloud

Latest News

Kafka Security Auditing: Tools and Techniques

Let’s face it—when it comes to security in Kafka, you can’t afford to mess around. With more and more sensitive data streaming through Kafka environments, it’s no surprise that Kafka security auditing has become a crucial part of ensuring both compliance and overall security. But if you’re new to this or feel like your current process needs a tune-up, don’t worry—we’ve got your back.

Trace your applications end to end with Datadog and OpenTelemetry

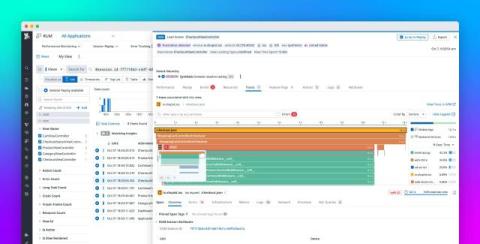
As teams adopt OpenTelemetry (OTel) to instrument their systems in a vendor-neutral way, they often face a challenge in effectively tracing activity throughout their entire stack, from frontend user interactions to backend services and databases. While OTel enables basic tracing, teams still need a way to access advanced capabilities like continuous profiling to adequately optimize performance and troubleshoot issues in their applications.

Datadog named a Leader in first ever 2024 Gartner Magic Quadrant for Digital Experience Monitoring

We are thrilled to announce that Datadog has been named a Leader in the first ever 2024 Gartner Magic Quadrant for Digital Experience Monitoring. Datadog was positioned the highest in its Ability to Execute. We believe this placement reflects our commitment to being an end-to-end observability platform that brings together all signals from across your tech stack into a unified ecosystem.

Understanding Jaeger - From Basics to Advanced Distributed Tracing

Jaeger has emerged as a crucial tool in the modern distributed systems landscape, offering powerful tracing capabilities that help organizations understand and optimize their microservices architectures. This comprehensive guide explores everything from basic concepts to advanced implementations, providing you with the knowledge needed to effectively implement and utilize Jaeger in your environment.

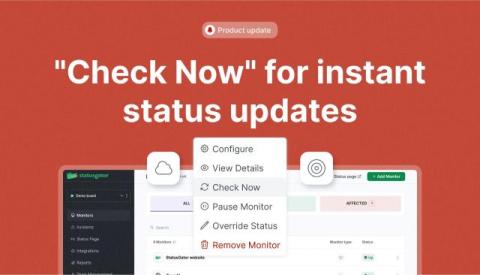
"Check Now" for instant status updates

We’ve just rolled out a new Check Now feature for Website and Ping monitors! This lets you manually check the current status of your monitor instantly, right from the admin board. Whether you’re monitoring a Website or using a Ping monitor, this option provides the most up-to-date status when you need it. To access the Check Now feature, simply go to your Monitors page, find the Website or Ping monitor you’d like to check, and click the three dots icon next to it.

Optimizing Kubernetes workloads with AI-powered monitoring

Kubernetes has drastically simplified application deployment. However, managing workloads in Kubernetes is a challenge because of their innate complexity and dynamism. Frequent bottlenecks and unpredictable application behavior can make managing Kubernetes workloads much harder. This has become simpler and lighter after the expansion of AI, which provides a more intelligent approach to managing and optimizing Kubernetes environments.

Scaling Culture on Purpose: How Cribl is Building for the Future After Our Series E

Cribl’s recent $319M Series E round marks a significant milestone in our journey to becoming a generational company. While this growth opens the door to new opportunities for our company, it also presents a challenge: how do we ensure our amazing culture scales alongside the business? At Cribl, we believe in Culture on Purpose—an intentional, values-led approach to evolving our culture as we grow.

Debugging Kubernetes pod pending failures

Every pod has its purpose. During an application deployment, all the workloads in the cluster work cohesively and ensure that the deployment launches—without any hiccups. When a pod is created, it starts its lifetime in a Pending state. A pod is in the Pending state when it is still in the process of being scheduled for deployment. When it is scheduled for deployment and the containers have started, it converts to the Running phase. It only takes a few seconds for the phase transition.

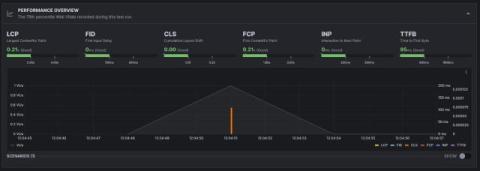
Browser testing in Grafana Cloud k6: how to optimize frontend web performance

Modern websites typically have a backend API and a frontend user interface. Testing both is essential to deliver a reliable user experience and optimize engagement. Historically, Grafana Cloud k6 has helped you check one of these boxes, allowing you to test your website’s backend APIs with protocol tests. Now, we are excited to share that you can also validate your website’s frontend performance with the new browser testing feature in Grafana Cloud k6.

Catchpoint named a leader in the 2024 Gartner Magic Quadrant for Digital Experience Monitoring

We're honored to announce that Catchpoint has been named a Leader in Gartner's first-ever Magic Quadrant for Digital Experience Monitoring (DEM). We believe this recognition reflects the rapid pace of innovation of our Internet Performance Monitoring (IPM) platform.