Operations | Monitoring | ITSM | DevOps | Cloud

Latest News

What is an SNMP trap? A complete overview

SHARE Simple Network Management Protocol (SNMP) traps are messages sent by SNMP devices that notify network monitoring systems about device events or significant status changes. At LogicMonitor, our view on SNMP has evolved over the years. While we have often favored other logging methods that offered more insights and were considered easier to analyze in the past, we recognize that SNMP traps remain an essential tool in network management.

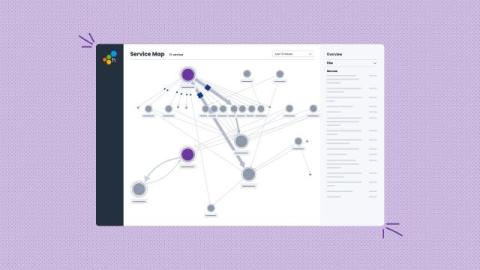
Using Honeycomb for Frontend Observability to Improve Honeycomb

Recently, we announced the launch of Honeycomb for Frontend Observability, our new solution that helps frontend developers move from traditional monitoring to observability. What this means in practice is that frontend developers are no longer limited to a metrics view of their app that can only be disaggregated in a few dimensions. Now, they can enjoy the full power of observability, where their app collects a broad set of data as traces to enable much richer analysis of the state of a web service.

Container monitoring with Grafana: Helpful resources to get started

In simple terms, containers are a standard package of software that enable applications to run consistently across different computing environments. Often, these applications are broken down into smaller collections of independent services known as microservices. For many organizations, these microservices-based applications have replaced traditional monolithic applications because they offer increased performance, flexibility, and scale.

Top 6 Tips for Forwarding Logs

Log forwarding can be seen as the first step towards centralized log management. With centralized log management, your organization can gain from enhanced visibility, monitoring, and analysis capabilities, making it a coveted practice for numerous organizations. Log forwarding is crucial for maintaining robust IT security and operational efficiency, allowing organizations to manage and analyze logs from multiple systems in a centralized, scalable manner.

The Journey to Autonomic IT: Progressing to AI-Advised IT

So far, we’ve detailed the Autonomic IT maturity model and discussed the characteristics of the early stages of that journey, progressing from “Siloed IT” to “Coordinated IT” and then to “Machine-Assisted IT in recent blog posts.” Wherever your organization is on this journey, there is likely still work to be done.

Debugging a Slack Integration with Sentry's Trace View

While building Sentry, we also use Sentry to identify bugs, performance slowdowns, and issues that worsen our users’ experience. With our focus on keeping developers in their flow as much as possible, that often means identifying, fixing, and improving our integrations with other critical developer tools. Recently, one of our customers reported an issue with our Slack integration that I was able to debug and resolve with the help of our Trace View.

Learn How Slack Helps SREs Stay Ahead of Service Disruptions

Site Reliability Engineers (SREs) are crucial for the smooth delivery of online services. Their job is to ensure that systems are reliable, available, and efficient. But when things go wrong, they’re the ones who jump into action to fix issues as fast as possible. And with modern systems being as complex as they are, managing service disruptions can be quite a challenge. This is where Slack comes in. It’s more than just a chat tool.

Integrating Open edX with AppSignal

Imagine stepping into the role of a DevOps engineer at an online learning company that utilizes Open edX as its core Learning Management System (LMS). As the platform scales to accommodate more learners, a myriad of challenges begin to surface: These are just the tip of the iceberg. It's pivotal that you provide timely reports on site performance and error tracking in real time, and fix any issues before they affect a significant user base.

New Relic vs AppDynamics - A Detailed Comparison for 2024

New Relic and AppDynamics are leading monitoring and observability tools for monitoring the performance of your applications and network. Both help you keep track of how well your systems are running, but they do it in different ways. New Relic is a great tool for APM, making it versatile for tracking overall system performance. It also features an easy-to-use interface and strong data visualization.
Sponsored Post

Responsible engineering prevents costly failures in a scaling world

Here at Raygun, we are committed to providing awesome digital experiences. Technology can transform the digital world, just like the physical one, for the people's benefit. We believe responsible engineering drives this transformation, which we summarize as follows: In this article, we demonstrate how these core principles-which we all share at Raygun-have informed the design of our tools. Software tools enable engineers to assure the quality of their evolving products, and ultimately support seamless digital experiences for end users.