Operations | Monitoring | ITSM | DevOps | Cloud

Latest News

Open Source Alternatives to Tracealyzer

Tracealyzer is a popular tool for visualizing and analyzing the execution of real-time systems, but its price tag can be a barrier for some developers. This guide explores powerful open-source alternatives that provide similar functionality for free, helping you choose the right tool for your embedded systems projects.

OpenFeature - A Guide to Open-Source Feature Flagging

Feature flags are crucial in modern software development, allowing teams to safely deploy and test new features. However, the absence of standardization has resulted in fragmentation and vendor lock-in. OpenFeature addresses this by offering an open specification for feature flagging, set to transform how developers manage and implement feature flags across various projects.

The Rise of Open Source Time Series Databases

Time series databases allow you to store and query metrics efficiently. For example, if you want to forecast load on your servers, or identify intermittent faults with your production services, time series databases can help. Besides infrastructure monitoring, time series databases have been invaluable in finance, IoT applications, manufacturing, and more. Many time series databases, including VictoriaMetrics, are open source.

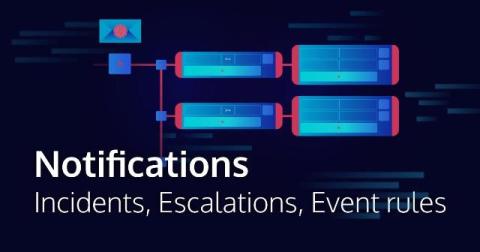
Icinga Notifications: Incidents, Escalations, and Event Rules

Following the Icinga Notifications beta announcement, we already had a more general post on how to get started and one going into the details of schedules. This week’s blog post is a follow up in this series and will describe incidents, escalations, and event rules in Icinga Notifications in more detail. In case you haven’t seen the first two referenced blog posts, you might want to have a look at them first, otherwise, you could miss out on the big picture.

The Catchpoint Enterprise data source for Grafana: key features and how to get started

Earlier this year, we were thrilled to announce that Catchpoint is now available as an Enterprise data source for Grafana! With the public preview release of the Catchpoint Enterprise data source, you can seamlessly bring Catchpoint’s extensive Digital Experience Monitoring (DEM) and Internet Performance Monitoring (IPM) capabilities into your Grafana dashboards, enhancing your ability to visualize and analyze performance metrics in real-time.

New Relic vs Splunk - In-depth Comparison [2024]

New Relic and Splunk are two prominent tools in the world of observability and monitoring, each serving distinct purposes. New Relic is used for Application Performance Monitoring (APM), offering a full-stack observability platform. It is important to note that New Relic is not a SIEM tool, its primary focus is performance monitoring. On the other hand, Splunk is used for log management, machine data analytics, and is widely utilized as a SIEM tool.