Operations | Monitoring | ITSM | DevOps | Cloud

Latest News

Sponsored Post

What Customers Love About Exoprise

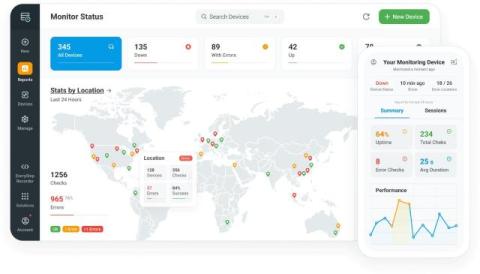
At Exoprise, we always listen to customers' input and ensure they have the best experience possible. Our customer success, support, and engineering teams have been hard at work, collecting this feedback and insights to identify the functionality and features loved by our customers. Today, we'll be sharing the top five favorites that have been brought to our attention in recent conversations. These features, some well-known and widely used, to some more powerful yet lesser-known functionalities. Whether you're new to Exoprise or a seasoned user, you may discover something new and valuable.

What Are Network Packet Drops & How to Measure Them

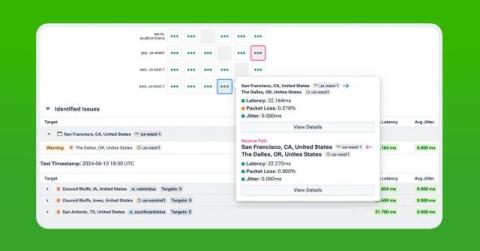
Imagine you’re in the middle of a phone call, and suddenly, the conversation cuts out for a moment. You miss a word, a sentence, or even an entire part of the discussion. It’s frustrating, right? This interruption is similar to what happens in a network when data packets are dropped and fail to reach their destination. These interruptions are known as network packet drops.

Lumigo Introduces AI to Simplify Observability Workflows

Lumigo is expanding its troubleshooting and observability platform with cutting-edge AI-powered tooling, now available in beta, which will provide developers and DevOps teams with the fastest and most cost-efficient way to debug and observe complex microservices. AI is quickly reshaping the technology landscape. However, observability tools have been slow to find ways to leverage AI in a fashion that provides tangible value.

With AppNeta, ResultsCX Decreases Network Performance Triage Time by 90%

In order to deliver its differentiated, boutique level of customer care services, the team at ResultsCX has had to navigate some challenges in recent years that teams in many organizations can relate to. The organization relies extensively and constantly on its network connections—and outages and poor performance can be a big problem. This post offers an introduction to the challenges the company was facing, and it reveals how AppNeta by Broadcom delivered the solution they needed.

Introducing a New, Zero-Touch Way to Manage Your DX NetOps Upgrades

For every customer who has an existing DX NetOps solution deployed, an upgrade can be a daunting task. Even for seasoned administrators, the process of logging into each box, running the pre-checks, and then executing the installers can be tedious. With the solution’s support for zero-touch administration (ZTA), the effort becomes easier. Now, you can plan, test, and then finally upgrade your deployment versions in one session.

Understanding Network Traffic Blockages in AWS

In this post, explore the challenges of diagnosing network traffic blockages in AWS due to the complex and dynamic nature of cloud networks. Learn how Kentik addresses these issues by integrating AWS flow data, metrics, and security policies into a single view, allowing engineers to quickly identify the source of blockages enhancing visibility and speeding up the resolution process.

Syslog 101: Everything You Need To Know

System logging protocol, abbreviated as Syslog, is a standard protocol used for message logging. Put simply, it is a standard for collecting and storing log information. A Syslog server collects, parses, stores, examines, and dispatches log messages from devices including routers, switches, firewalls, Linux/Unix hosts, and Windows machines.

Observability vs Monitoring [Understanding the Key Differences in 2024]

When systems fail, it's not just a technical hiccup – it's a business problem. Downtime means unhappy customers and lost revenue. That's why teams need effective ways to spot issues fast and fix them even faster. This is where monitoring and observability come into play. Monitoring and observability are two key approaches to keeping your systems running smoothly. Monitoring is like your system's alarm bell – it tells you when something's wrong.