Operations | Monitoring | ITSM | DevOps | Cloud
Latest News
Key Multi-tenancy Challenges in the Public Cloud and How to Solve for Them
Nobody wants to deal with annoying neighbors. Whether it’s the neighbor who always knows everyone’s business or the one who turns up their music late at night, both types of neighbors can have a negative impact on your living environment and daily life. Obnoxious neighbors aren't exclusive to just your physical living space, but in the public cloud where there are multiple Kubernetes clusters (EKS, AKS, or GKE) and multiple users (or tenants) with the need for cluster access.
New Integration: Create Google Meet Incident Bridges Automatically
We’re happy to announce our integration with Google Meet to create incident bridges automatically. Using the power of FireHydrant Runbooks, a Google Meet can be added with fully customizable titles and agendas based on your incident details.
Create powerful data visualizations with the new Datadog dashboards experience
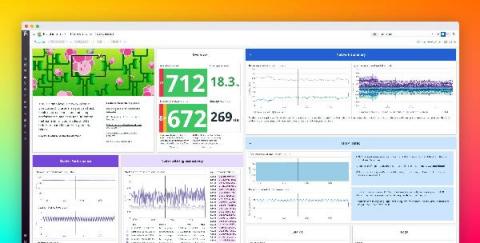
Dashboards are a crucial tool in your monitoring arsenal, as they allow you to visualize and correlate telemetry data from across your stack in a single place. Historically, Datadog offered two dashboard types: Screenboards, for pixel-level control on a canvas, and Timeboards, for troubleshooting a specific point in time. Now, we’re excited to introduce a new dashboard layout that combines the best of Timeboards and Screenboards in a single, seamless editing experience.
How to debug Kubernetes Pending pods and scheduling failures
When Kubernetes launches and schedules workloads in your cluster, such as during an update or scaling event, you can expect to see short-lived spikes in the number of Pending pods. As long as your cluster has sufficient resources, Pending pods usually transition to Running status on their own as the Kubernetes scheduler assigns them to suitable nodes. However, in some scenarios, Pending pods will fail to get scheduled until you fix the underlying problem.
Use Datadog's Notebooks API to programmatically manage your notebooks
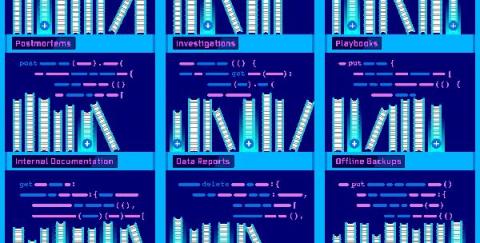
Datadog Notebooks simplify the way teams across an organization find and share knowledge. By bringing together live data and rich Markdown text, Notebooks help teams create powerful, data-driven documents—from runbooks and support playbooks to incident postmortems and data reports. And with collaboration functionalities like real-time editing and commenting, team members can simultaneously make changes to a document and gather feedback along the way.
How Query Sampling Improves Database Performance
Untangling Network Policies on K8s
Network Policy is a critical part of building a robust developer platform, but the learning curve to address complex real-world policies is not tiny. It is painful to get the YAML syntax right. There are many subtleties in the behavior of the network policy specification (e.g., default allow/deny, wildcarding, rules combination, etc.). Even an experienced Kubernetes YAML-wrangler can still easily tie their brain in knots working through an advanced network policy use case.
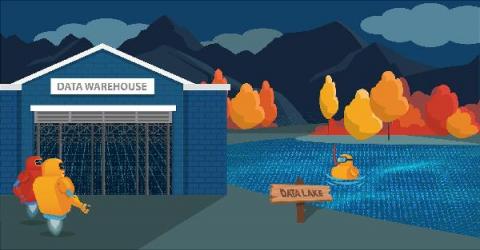
Data Lake, Data Lab, Data Hub: what's the difference?
In this post we’ll explore the concepts of data lake, data hub and data lab. There are many opinions and interpretations of these concepts, and they are broadly comparable. In fact, many might say they’re synonymous and we’re just splitting hairs. But let’s look again carefully. We can discern some subtle trends in the way people are doing things, and find distinctions in these expressions.
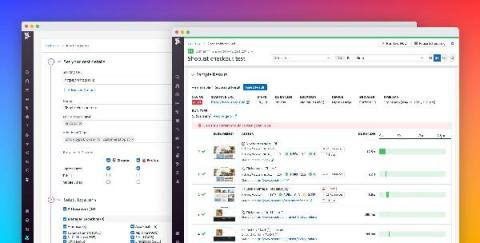
Datadog Synthetic Monitoring now supports cross-browser testing
Your users access your application from a wide range of browsers, which have their own implementations of HTML, CSS, and JavaScript. For instance, many modern JavaScript features such as Promises and Arrow Functions are unsupported by some browsers. These inconsistencies can lead to missing elements and malfunctioning workflows that affect some—but not all—of your user base.


