Operations | Monitoring | ITSM | DevOps | Cloud

9 Common Website Errors and How to Fix Them

Did you know that 88% of online consumers are less likely to return to a website after a bad user experience? This means that no matter how small, website errors can significantly impact your website's traffic and revenue. As a website owner or manager, it's crucial to identify and fix common errors to ensure your website runs smoothly and provides an exceptional user experience. But where do you start? With so many potential issues that can arise, it can be overwhelming to know what to prioritize.

Monitor Azure OpenAI with Datadog

Azure OpenAI is a service for deploying AI applications on Azure resources. With its easy-to-use REST APIs, you can leverage the service to access OpenAI’s powerful language models, such as ChatGPT, for your applications while taking advantage of the reliability and security of the Azure platform. Datadog already offers an out-of-the-box integration for OpenAI so you can monitor key performance trends, such as API usage patterns, token consumption, and more.

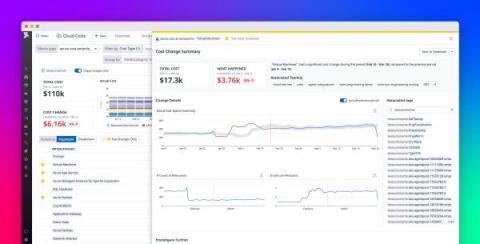
Avoid Azure migration cost overruns with Datadog Cloud Cost Management

Migrating your on-prem applications to Azure can help you improve scalability, reliability, and security. It can also help reduce costs and free your engineering teams to focus on innovation and performance optimization. But it can be hard to understand Azure costs as they evolve during your migration and to see how they correlate with your resource utilization once you’re up and running in Azure.

Monitor mainframe activity with Bottomline's Record and Replay offering in the Datadog Marketplace

Many organizations have faced the complex challenges that come with mainframe monitoring. MIPS-based cost models make native mainframe software expensive, and deploying individual agents to user desktops and devices is difficult to maintain and scale.

Top 20 Server Monitoring Tools of 2023

A server monitoring tool is software that monitors the operation and general health of servers and other components of IT infrastructure. These tools continuously track and gather information on a variety of parameters, such as CPU utilization, memory usage, disc space consumption, network traffic, and application performance. So, you get real-time insights into a server’s functionality and health, and IT specialists can identify and address issues before they affect end users.

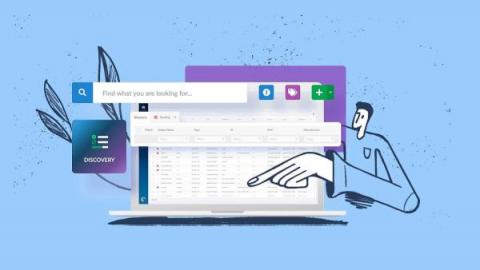
IT Asset Discovery: What is it, How it Works, And Why You Need it

IT asset discovery is a critical process for any organization looking to manage its IT infrastructure effectively. With a rapid growth of dependency on technology for everyday work, and an increasing amount of remote work, keeping track of all hardware and software assets within an organization can be challenging. And this is where IT asset discovery tools come in to help you through the process. These solutions provide clear and reliable access to everything connected to your company network.

Sentry for SvelteKit

We’re happy to announce that the Sentry SvelteKit SDK is now generally available and ready to help you monitor your SvelteKit application. Last year, we entered the Svelte ecosystem by creating an SDK for Svelte, which provides support for Svelte single page apps. We knew that SvelteKit was already quite far along back then and we kept a close eye on its development. We also received a lot of requests from the community to support SvelteKit.

PagerDuty Launches New Innovations to Reduce Tool Sprawl and Optimize Operations

The number of tools used by distributed teams to manage incidents has multiplied over the years, leading to a valley of tool sprawl. Throw in manual processes and you’ve got too much toil and multiple points of failure. Maintaining disparate tools and systems isn’t just unwieldy, it’s expensive. Our latest capabilities add to the PagerDuty Operations Cloud to make it easier than ever for teams to consolidate their incident management stack.

A Place for Everything and Everything in Its Place

With Cribl Stream, our customers are experiencing choice and control over their data that would have been a pipe dream (or maybe I should say a pipeline dream) before. The ability to get the right data to the right destination in the right format is extremely powerful. Stream can optimize the data being sent to expensive destinations; you can remove unnecessary or redundant fields, drop unnecessary events, or even pull valuable metrics from verbose logs. Optimizing your data has a few benefits.

What is Observability?

“Observability” seems to be the buzzword du jour in IT these days but what does it actually mean, and how is it any different from plain, old monitoring? In simple terms, observability is the ability to understand how a system is performing and how it is behaving from the data that system generates. It is not just about monitoring metrics or collecting logs, but also understanding the context of those metrics and logs, and how they relate to the overall health of the system.