Operations | Monitoring | ITSM | DevOps | Cloud

Latest Videos

GrafanaCONline: Industrial process monitoring: oil and gas industry

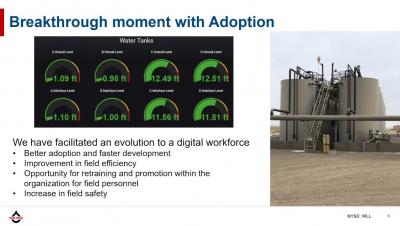
We have been utilizing Grafana at Whiting Oil and Gas for approximately three years. In that time, we have greatly impacted the way our field assets are managed through dashboards and alerting. Instead of servers and network data, Whiting is using the application to monitor oil and gas wells in remote locations. Historically, the energy industry has deployed very expensive tools to monitor assets and visualize data.

How to Monitor Services

Learn how to add a Service Monitor to your monitored server in PA Server Monitor. The Service Monitor watches the same system services that can be seen from the Administrator Tools Services applet (services.msc). If a service is not running, actions are fired (which could notify you and/or restart the service for example). The Restart Service action is typically attached to this monitor.

Automated incident response with Flowmon and FortiGate

Flowmon has teamed up with Fortinet to provide security administrators with an integrated solution for automated threat detection and incident response. Join this webinar to learn about the benefits of the integration between Flowmon and the FortiGate next-generation firewall. You will experience a live demo demonstrating how Flowmon’s detection capabilities can enhance FortiGate’s security enforcement to create a truly automated security matrix. Incident logging to FortiSIEM included.

Webinar: Logging Best Practices in the CI/CD Era

With the overabundance of log data available today, it’s easy to simply limit logging events. However, this pattern overlooks the latent value in your log data. To be proactive, rather than reactive. Utilizing experience serving 1,000+ customers worldwide, Ariel Assaraf, CEO of Coralogix, will show you how to transform your logs into a treasure trove of opportunities for improving business decisions and anticipating operational problems before they happen.