

Operations | Monitoring | ITSM | DevOps | Cloud

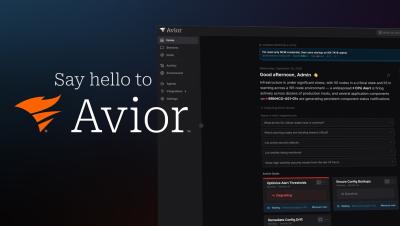
Autonomous IT: Data, Context, and Governed Action | 2H Announcement from LogicMonitor

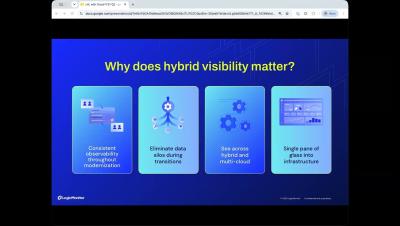
Autonomous IT requires three things: complete, AI-ready data; connected context; and governed action. In LogicMonitor's 2H announcement, we show enterprise IT and ITOps leaders how each layer works. LogicMonitor is the AI-first platform for Autonomous IT. This update covers the three layers behind autonomous IT operations as the category moves from systems of intelligence to systems of action. Your team decides when Edwin AI moves from recommending an action to taking it.
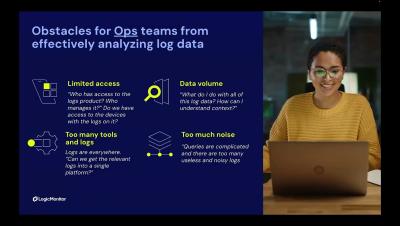
LM Logs Tips: Alert-to-Logs Workflow for Ops Team | Logs for Lunch

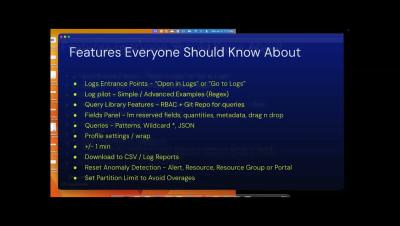
LM Logs troubleshooting starts at the alert. This Logs for Lunch session shows ITOps teams an alert-to-logs workflow and lesser-known LM Logs tips. Ryan Matuszewski demos a Tomcat application error. From the alert's Logs tab, he moves through log anomaly detection, All Logs, Log Patterns, and Log Analysis sorted by sentiment. He then opens the Logs page with the alert time range, and the same steps work for any alert type.

Cloud Log Monitoring & Root Cause Analysis | Logs for Lunch

Cloud log monitoring in LogicMonitor connects a service alert to the log event behind it. This Logs for Lunch July demo is for ITOps, CloudOps, and SRE teams. Tom Chavez hosts Ismath Mohideen (Product Marketing) and Nick Doane (Senior Sales Engineer). They cover cloud observability and multi-cloud monitoring across AWS, Azure, GCP, and OCI in LM Envision, using cloud provider APIs with no extra collectors.

SNMP Traps as Logs and Network Troubleshooting | Logs for Lunch

SNMP traps as logs, AI log anomaly detection, and network troubleshooting are the focus of Logs for Lunch: August 2026, for network and IT ops teams and LogicMonitor users. Tom Chavez introduces LM Logs, which keeps logs and metrics together. Cameron Compton troubleshoots dropped tunnel packets from a network operations dashboard, and Ron Scinta ingests SNMP traps through the Collector. Patrick Sites and Kerry DeVilbiss answer questions on load balancing, OTel and Cribl forwarding, MSP log sources, and search performance.

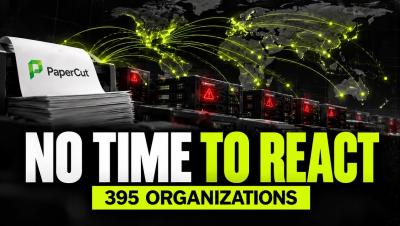
AI Agents Hacked 395 Organizations. How Do You Stop Them?

AI agents just changed the speed of cyberattacks. Are security teams ready? In a massive AI-orchestrated cyberattack, hundreds of autonomous AI agents exploited vulnerabilities in PaperCut software, compromising 440 servers across 395 organizations in 48 countries. But the bigger question isn't how these attacks happened. It's how human security teams are supposed to respond when attacks move faster than they can react.

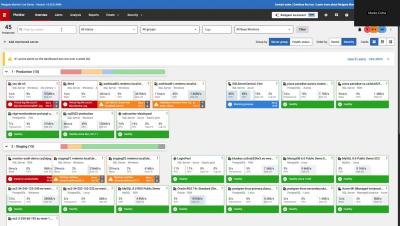
Is Redgate Monitor a multi-platform tool or SQL Server only?

Redgate Monitor is a multi-platform database monitoring tool, not a SQL Server only tool. It monitors SQL Server, PostgreSQL, Oracle, MySQL and MongoDB from a single dashboard, on premises or in the cloud. This demo shows SQL Server, PostgreSQL and Oracle instances in the Redgate Monitor live demo environment.

TC201: Enterprise Power, Exceptional Value for Your Frontline Team | Zebra

Equip your frontline team for success with the Zebra TC201 mobile computer. This rugged device combines enterprise-grade power, built-in security, and exceptional value to boost productivity and efficiency across your entire operation. From the sales floor to the warehouse and out on the road, the TC201 is the tool your team can count on.

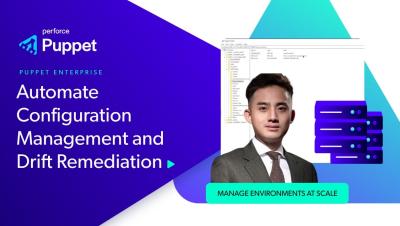
Automate Configuration Management and Drift Remediation at Scale

Learn how Puppet Enterprise by Perforce automates configuration management, enforces desired state, and enables automatic drift remediation across Windows servers at scale. In this demo, Matthew, Associate Sales Engineer at Puppet, shows how to use Puppet Enterprise to deploy and manage Windows registry configurations across multiple servers from a single console. See how infrastructure as code helps eliminate manual configuration tasks, reduce human error, and maintain consistent system configurations across your environment.