Operations | Monitoring | ITSM | DevOps | Cloud
The latest News and Information on Log Management, Log Analytics and related technologies.
The 12 Cats of Observability
On the surface, business-critical IT infrastructure and cats may not seem like they have a lot in common. But they’re way more alike than you might think. Our feline friends contain multitudes, as any cat parent will tell you. They’re complex and can sometimes drive you up a wall. But once they warm up to you—and you warm up to them—the joys and benefits of having them in your life outweigh just about everything. Sounds a lot like technology, right?
What to Do When You Have 1000+ Fields?
How to Manually Instrument Java with OpenTelemetry (Part 1)
How to Manually Instrument Java with OpenTelemetry (Part 2)
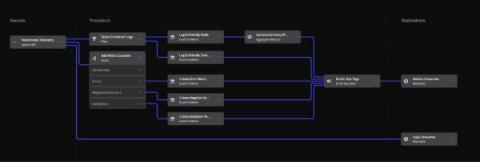
Understand Your Kubernetes Telemetry Data in Less Than 5 Minutes: Try Mezmo's New Welcome Pipeline
Most vendor trials take quite a bit of effort and time. Now, with Mezmo’s new Welcome Pipeline, you can get results with your Kubernetes telemetry data in just a couple of minutes. But first, let’s discuss why Kubernetes data is such a challenge, and then we’ll overview the steps.
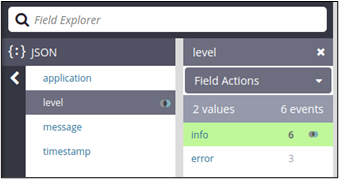
Effective Logging in Node.js Microservices
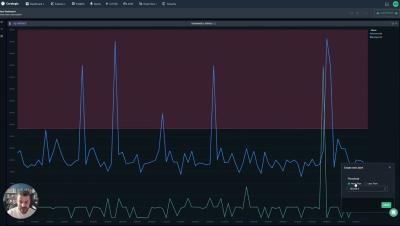
Easy Alert and Metric Creation in Coralogix Custom Dashboards
Logz.io Shines Again! Named on Constellation Observability Shortlist
Logz.io continues to be recognized as a standout observability platform, this time being named by the Constellation Shortlist for Observability. Logz.io—provider of the Open 360™ platform for essential observability—was among 14 vendors selected after a review of more than 50 solutions based on client inquiries, partner conversations, customer references, vendor selection projects, market share and other internal research.
Manual instrumentation of Java applications with OpenTelemetry
In the fast-paced universe of software development, especially in the cloud-native realm, DevOps and SRE teams are increasingly emerging as essential partners in application stability and growth. DevOps engineers continuously optimize software delivery, while SRE teams act as the stewards of application reliability, scalability, and top-tier performance. The challenge?


