Operations | Monitoring | ITSM | DevOps | Cloud
The latest News and Information on Log Management, Log Analytics and related technologies.
How Gaming Analytics and Player Interactions Enhance Mobile App Development
How to Strengthen Kubernetes with Secure Observability
Kubernetes is the leading container orchestration platform and has developed into the backbone technology for many organizations’ modern applications and infrastructure. As an open source project, “K8s” is also one of the largest success stories to ever emanate from the Cloud Native Computing Foundation (CNCF). In short, Kubernetes has revolutionized the way organizations deploy, manage, and scale applications.
How to Effortlessly Deploy Cribl Edge on Windows, Linux, and Kubernetes
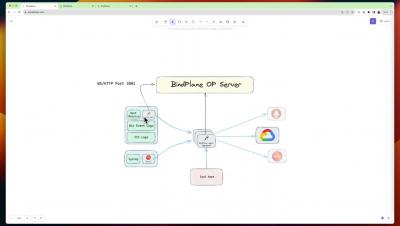
Collecting and processing logs, metrics, and application data from endpoints have caused many ITOps and SecOps engineers to go gray sooner than they would have liked. Delivering observability data to its proper destination from Linux and Windows machines, apps, or microservices is way more difficult than it needs to be. We created Cribl Edge to save the rest of that beautiful head of hair of yours.
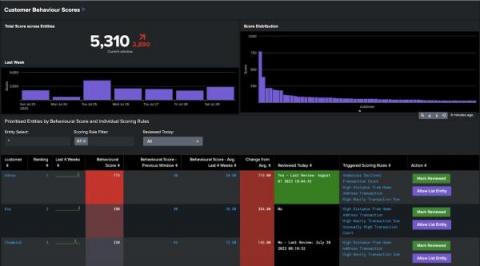
Introducing the Splunk App for Behavioral Profiling
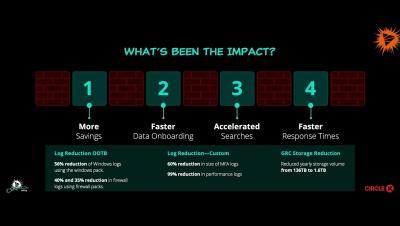
Getting _____________ for Less from Your Analytics Tools
Apica Acquires LOGIQ.AI to Revolutionize Observability
In the world of observability, having the right amount of data is key. For years Apica has led the way, utilizing synthetic monitoring to evaluate the performance of critical transactions and customer flows, ensuring businesses have important insight and lead time regarding potential issues.
Optimizing cloud resources and cost with APM metadata in Elastic Observability
Application performance monitoring (APM) is much more than capturing and tracking errors and stack traces. Today’s cloud-based businesses deploy applications across various regions and even cloud providers. So, harnessing the power of metadata provided by the Elastic APM agents becomes more critical. Leveraging the metadata, including crucial information like cloud region, provider, and machine type, allows us to track costs across the application stack.
What Is AI Monitoring and Why Is It Important
Artificial intelligence (AI) has emerged as a transformative force, empowering businesses and software engineers to scale and push the boundaries of what was once thought impossible. However as AI is accepted in more professional spaces, the complexity of managing AI systems seems to grow. Monitoring AI usage has become a critical practice for organizations to ensure optimal performance, resource efficiency, and provide a seamless user experience.


