Operations | Monitoring | ITSM | DevOps | Cloud
The latest News and Information on Log Management, Log Analytics and related technologies.
The Evolution of the Service Model In the Data Industry
10 Best Dynatrace Alternatives [2023 Comparison]
Dynatrace has established itself as a prominent player in the field of application performance management, but given that Dynatrace is an expensive solution aimed at large enterprises, exploring your options is essential. This comprehensive article presents a handpicked selection of the top 10 Dynatrace alternatives, each offering distinct advantages and capabilities.
Create PromQL alerts in Cloud Monitoring now in Public Preview
You can now create globally scoped alerting policies based on PromQL queries alongside yourtheir Cloud Monitoring metrics and dashboards.
Follow Splunk Down a Guided Path to Resilience
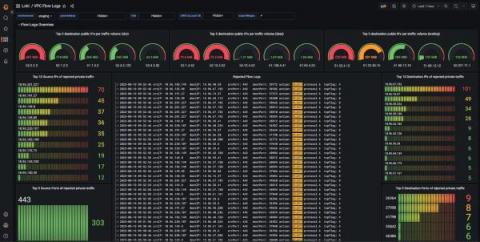
How Qonto used Grafana Loki to build its network observability platform
Christophe is a self-taught engineer from France who specializes in site reliability engineering. He spends most of his time building systems with open-source technologies. In his free time, Christophe enjoys traveling and discovering new cultures, but he would also settle for a good book by the pool with a lemon sorbet.
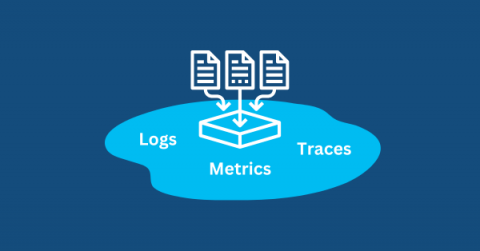
Splashing into Data Lakes: The Reservoir of Observability
Sumo Logic Customer Brown Bag - Logging - Data Tiers - August 9, 2023
Managing Kubernetes Log Data at Scale | Civo Navigate NA 2023
The Pleasure of Finding Things Out: Federated Search Across All Major Cloud Providers and Native Support for Amazon Security Lake
The newly released Cribl Search 4.2 brings enhancements that ease data management in today’s complex, cloud-centric environments. This update provides comprehensive compatibility with all major cloud providers – Amazon S3, Google Cloud Storage, and Azure Blob Storage. It also ushers in native support for Amazon Security Lake. In this blog post, we’ll examine how new dataset providers enhance the value that Cribl Search delivers, out of the box.


