Operations | Monitoring | ITSM | DevOps | Cloud

Logging

The latest News and Information on Log Management, Log Analytics and related technologies.

Mezmo Named to Inc. 5000's List of Fastest Growing Companies in the Nation

Inc. is shining a light on Mezmo as one of the fastest growing companies in the nation. We are truly honored to be featured alongside innovative brands like Sentry and Calendly, who are building the future of tech. Our position on the list at number 695 reflects our 900% growth in revenue and 300% growth in the size of our team from 2018 to 2021.

Best Practices for Navigating the Security Poverty Line

InfoSec, like any other aspect of IT, is a matter of three factors coming together: people, process and technology. All of these factors cost time and money in some way. The truth is, there are very few organizations out there who can supply their own security programs, staff, technology, processes and everything needed for InfoSec to an efficient degree. Everyone has to compromise in some way.

Are Your Engineers Gonna Need A Bigger Boat?

If you asked your engineering team how well they can handle all of the security and observability data they’re managing, would you get a resounding “Yeah boss, we’re good to go!” in response? Possible, but unlikely. Chances are they feel like they’re stuck on a boat that’s taking on water, spending their day using tiny buckets to scoop some of it out, with no way to plug any of the leaks.

Moving from an IT and Security Data Admin to an Observability Engineer

Join Ed Bailey, Nick Heudecker, and Jordan Perks as they discuss what it means to transition from acting simply as an IT and security data administrator to becoming a true observability engineer. In your role as an observability engineer, you’ll guide an organization on observability data best practices, enhance existing tool functionality, help control cost, and improve overall compliance.

Centralizing Log Data to Solve Tool Proliferation Chaos

As companies evolve and grow, so do the number of applications, databases, devices, cloud locations, and users. Often, this comes from teams adding tools instead of replacing them. As security teams solve individual problems, this tool adoption leads to disorganization, digital chaos, data silos, and information overload. Even worse, it means organizations have no way to correlate data confidently. By centralizing log data, you can overcome the data silos that tool proliferation creates.

What's Missing From Almost Every Alerting Solution in 2022?

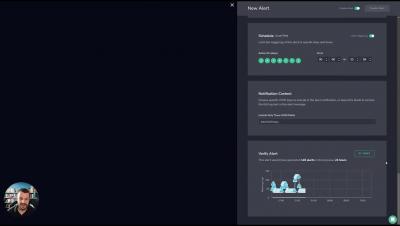
Alerting has been a fundamental part of operations strategy for the past decade. An entire industry is built around delivering valuable, actionable alerts to engineers and customers as quickly as possible. We will explore what’s missing from your alerts and how Coralogix Flow Alerts solve a fundamental problem in the observability industry.

Resiliency As the Next Step in the DevOps Transformation

We’ve reached the point in the DevOps transformation where efficiency and automation are no longer the highest objectives. The next step is engineering past automation and towards fully autonomous, self-healing systems. If you aren’t conversing about building this type of resilience into your systems and applications, there’s never been a better time than now to start.

IT Salaries: Trends, Roles, & Locations for 2022-2023

IT roles have never been more in demand and IT salaries have never been higher, according to recent reports and data sources. Whether you are hiring, looking for a career change, or simply work in tech, it’s important to stay up-to-date on the state of employment in the industry. This blog post will review, roundup, and summarize some of the latest trends for IT salaries and demand by role and location (among other variables) to help you get a clear view of the landscape.

Memory Profiling for Java Applications, a Splunk APM Product Walkthrough

Splunk’s Product Manager Priit Potter walks you through how to identify memory bottlenecks in Java applications, in this detailed product walkthrough. See how Priit troubleshoots his own application, visualizes memory performance problems, and uses flame graphs to detail the line of code responsible for the problem, all with the help of Splunk Application Performance Monitoring.