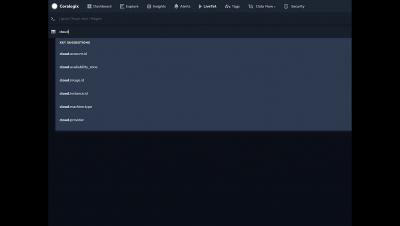
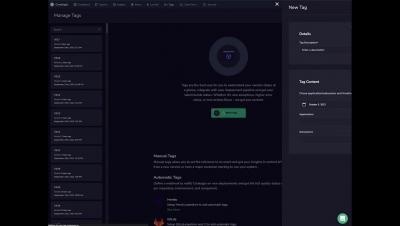
The latest News and Information on Log Management, Log Analytics and related technologies.
A typical bit of feedback I have had during my time at Splunk is that the Splunk Machine Learning Toolkit (MLTK) looks nice and all, but how are we supposed to get started using it? Choosing the right technique, let alone the right algorithm can be a daunting task for those who are unfamiliar with machine learning (ML). We’ve been thinking long and hard about how we can help offer more prescriptive introductions into using ML at Splunk and I’m pleased to present our set of MLTK deep dives.
MongoDB is a cross-platform NoSQL database that uses JSON-like documents with optional schema to store data. It was designed for high availability, high performance for high-data persistance use cases, and automatic scaling. Of course, all with the right infrastructure in mind. It is usually a good choice for document-oriented use cases when you need quick prototyping or massive scale. With the massive scale comes massive traffic, though.
So far in our series on scaling observability for game launches, we’ve discussed ways to 1) quickly analyze large volumes of telemetry data and, 2) ensure high-quality telemetry data for more effective analysis at lower costs. The best practices in these blogs outline best practices for scaling observability during game launch day – which is necessary to ensure high performance across all infrastructure components – to ensure no lag, no glitches, and no bugs.
What is an observability engineer? Is it your SIEM admin? How about your application performance monitoring admin? Neither? Both? Observability engineering is more than administering a tool. There is more to it than data onboarding, writing parsers, and getting data in. As an observability tool admin, you work with data producers and consumers to get data in a human-readable and searchable format from the source to the analytics system.