Operations | Monitoring | ITSM | DevOps | Cloud
The latest News and Information on Log Management, Log Analytics and related technologies.
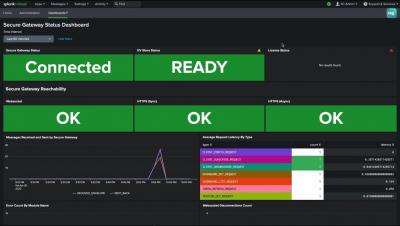
Troubleshoot Your Splunk Mobile Fleet
An Introduction to Syslog
Syslog is an event logging standard that lets almost any device or application send data about status, events, diagnostics, and more. It’s commonly used by network and storage devices to ship observability data to analytics platforms and SIEMs in order to support and secure the enterprise. Syslog is an excellent lightweight protocol to get telemetry from small scale devices.
Papertrail + Slack: Keeping On Top of Your Most Important Logs
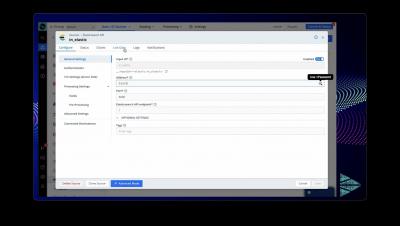
How to Onboard Windows Event data into Cribl Stream using Winlogbeats
Top 5 Reasons Why Splunk Is the Ideal Platform for Unified Security and Observability
Splunk embodies the top 5 principles of unified security and observability, and has been an expert in log management, security, and observability for years.
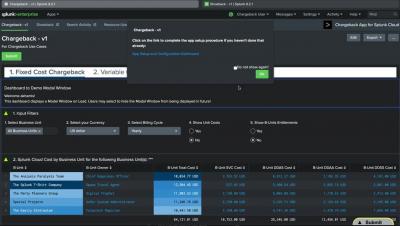
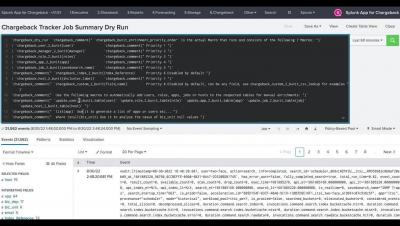
Splunk App for Chargeback Initial Set Up and Configuration
Quick Setup for the Splunk App for Chargeback
Send Amazon VPC flow logs to Amazon Kinesis Data Firehose and Datadog
Amazon Virtual Private Cloud (Amazon VPC) is an isolated and secure virtual network in which you can deploy resources, such as Amazon Elastic Compute Cloud (EC2) and Amazon Relational Database Service (RDS) instances, while restricting their exposure to the internet. As part of your monitoring strategy, you can collect and analyze VPC flow logs, which record network traffic flow between VPC components.
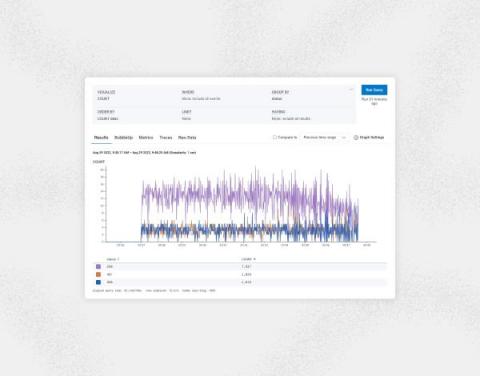
Sending NGINX Logs to Honeycomb is Darn Easy
Written by Andrew Puch and Brian Langbecker You use NGINX as a proxy for your application, and you want to leverage your favorite features in Honeycomb to help make sense of the traffic data. Have no fear: Honeycomb is more than capable and ready to help! Things you will need: Before you start with the instructions, let’s discuss a lightweight tool called Honeytail. This utility will tail log files, parse the various formats, and send the data to Honeycomb.


