Operations | Monitoring | ITSM | DevOps | Cloud

The latest News and Information on Log Management, Log Analytics and related technologies.

Debunking 4 Cybersecurity Myths About Machine Learning

Machine learning has infiltrated the world of security tooling over the last five years. That’s part of a broader shift in the overall software market, where seemingly every product is claiming to have some level of machine learning. You almost have to if you want your product to be considered a modern software solution. This is particularly true in the security industry, where snake oil salesmen are very pervasive and vendors typically aren’t asked to vigorously defend their claims.

Observability: You Can't Buy It, You Must Build It!

In Part 1 of this series, we talked about the origins of observability and why you need it. In this blog (Part 2), we will cover exactly what observability is, what it isn’t, and how to get started. Before we can dive into how to approach observability, let’s get one thing clear: You can’t buy a one-size-fits-all observability solution.

How to monitor Couchbase with Google Cloud Ops

You can now easily monitor couchbase metrics and logs in Google Cloud. All of our logging and monitoring Google Cloud contributions are available through the Google Ops Agent GitHub repository. You can check it out here! The Google Ops Agent uses the built-in Prometheus exporter and receiver to monitor Couchbase sources running Couchbase 7.0. You can find documentation on the Prometheus exporter in the Couchbase documentation.

Aggregations and Chains: Performance Measurement in Cribl Stream Pipelines

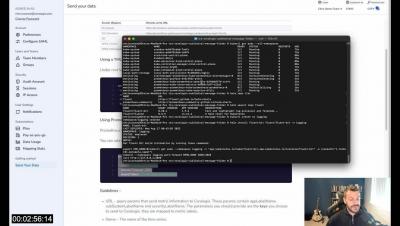
In this post, we’ll discuss two functions in the Cribl Stream arsenal: The Aggregations function, which allows you to perform stats and metrics collection in flight, and the Chain function allows you to call one Pipeline from within another. The event flow will continue when the Chained Pipeline returns. To demonstrate their use, we’ll answer this question: How long did it take for Cribl to process events using your pipeline?

Splunk Synthetic Monitoring in Splunk Observability Cloud - Product Demo

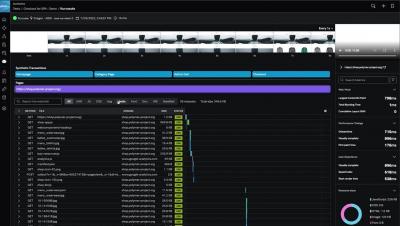
Splunk Synthetic Monitoring is now available in Splunk Observability Cloud allowing IT and engineering teams to proactively detect issues impacting web and API performance and end-user experience and troubleshoot and remediate issues in the web browser, the server, or a third-party dependency—all within a single UI. Watch this quick demo to learn more.

Using Splunk Observability Cloud to Monitor Splunk RUM

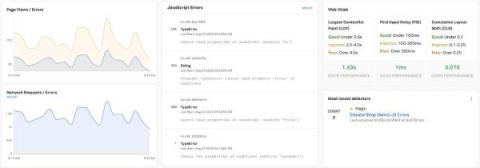
As a principal engineer on the Splunk Real User Monitoring (RUM) team who is responsible for measuring and monitoring our service-level agreements (SLAs) and service-level objectives (SLOs), I depend on observability to measure, visualize and troubleshoot our services. Our key SLA is to guarantee that our services are available and accessible 99.9% of the time.

Observability: A Concept That Goes Back to the Founding of the Internet

With its market size reaching more than $2 billion in 2020, you’d think that a universal definition of the term observability would have emerged by now. But it turns out that a clear definition of a term or industry isn’t necessarily a prerequisite for the rapid growth of its market size — just ask everyone at your next dinner party to define blockchain for you and see how many different answers you get!

Elastic Observability helps monitor your Azure workloads on the new Arm-based VMs

Microsoft Azure’s recently launched new Azure Virtual Machines (VMs) feature the Ampere Altra Arm-based processor. These new VMs are engineered to efficiently run horizontally scalable workloads such as web servers, application servers, and open source databases. They deliver excellent price-performance and represent an important addition to Microsoft Azure's portfolio of instance types.

Snowflake DB: Observing a Snowflake From Cloud to Chart

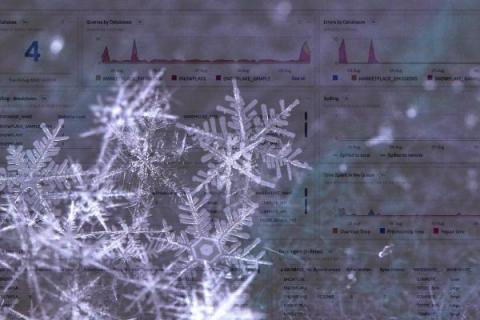
You’ve probably heard something like this before: “It’s a managed service! We don’t need to worry about anything!” But when it comes to your production workloads, database monitoring is imperative. With the new Snowflake Dashboards and Detectors in the Splunk Observability Content Contributors repository you can start seeing the details of individual Snowflakes.