Operations | Monitoring | ITSM | DevOps | Cloud

Logging

The latest News and Information on Log Management, Log Analytics and related technologies.

User Experience Monitoring and Synthetics with Elastic Observability

Elastic Observability 7.10 introduces exciting new capabilities that bring deeper visibility into the most important layer of digital monitoring — the experience of the end user. User experience monitoring — accessed via a brand new app in Kibana — provides real-time visibility into website performance, and multistep journey checks in Uptime significantly expand synthetic monitoring capabilities to help operational teams proactively catch issues by monitoring simulated journeys. Plus, several new features like searchable snapshots, out-of-the-box anomaly detection jobs for infrastructure monitoring, and a PHP agent for Elastic APM help the Elastic Observability community optimize costs while deepening visibility across operations.

Elastic 7.10 released, with a beta of searchable snapshots and the GA of Kibana Lens

We are pleased to announce the general availability of Elastic 7.10. This release brings a broad set of new capabilities to our Elastic Enterprise Search, Observability, and Security solutions, which are built on the Elastic Stack — Elasticsearch, Kibana, Beats, and Logstash. 7.10 delivers significant new capabilities to market, transforming the way in which our customers and users can trade off cost, performance, and depth of data with searchable snapshots.

How to Monitor Akamai Logs

Some of the largest and most prominent websites, worldwide, partner with Akamai to provide their customers with a premium web experience. What benefits could Akamai offer to you and your online product offerings? In this article, we will introduce you to Akamai and the services they provide. We’ll talk about why those services are essential and how they can help you provide a better online experience for your customers. We’ll also talk about how Akamai can protect you from cyberattacks.

ScaleUP 2020 Recap: Introducing Distributed Tracing & More

Today was a monumental day for Logz.io and our entire community. There is nothing more inspiring than seeing how people use the technology we’ve built to enhance their businesses. At ScaleUP 2020, our first ever global user conference, we hosted an exciting day of technical, customer-led sessions with our community. We also had the privilege of unveiling some ground-breaking new solutions and enhancements to our end-to-end cloud-native observability platform.

Getting started with Elastic on Google Cloud

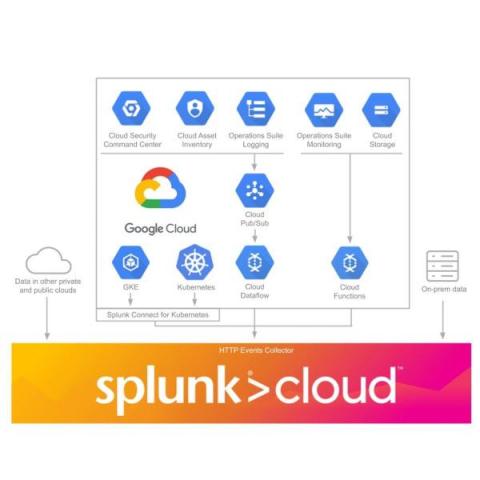
Elastic on Google Cloud gives you the power of Elastic Enterprise Search, Elastic Observability, Elastic Security as well as the Elastic Stack so you can quickly and easily search your environment for information, analyze data to observe insights, and protect your technology investments. Elastic Cloud lets you deploy your way, whether as a managed service, or with orchestration tools you manage in your Google Cloud environment.

CybersecAsia Awards 2020 recognizes ManageEngine for its leadership in cybersecurity

ManageEngine’s Log360 was recently honored with the CybersecAsia Award for the Best User and Entity Behavior Analytics software application. The award certifies the important role, and the innovative technology brought to the table by Log360 over the past two years. Elevated cybersecurity risks currently experienced by organizations have driven the sudden adoption of the cloud and increased workforce mobility.

Getting Started with Sematext Browser SDK for Front-end Performance Monitoring

Open-sourcing a code base for the world to see after working on it for a long time is a great experience. You should care about what your users want. You want your users to have a great experience using your product. Everything has to fall into place. Performance, responsiveness, user experience, etc. all have to be exceptional. That’s why I think front-end performance metrics are crucial.

Trace discovery in Grafana Tempo using Prometheus exemplars, Loki 2.0 queries, and more

Grafana Tempo, the recently announced distributed tracing backend, relies on integrations with other data sources for trace discovery. Tempo’s job is to store massive numbers of traces, place them in object storage, and retrieve them by id. Logs and exemplars allow users to quickly and more powerfully jump directly to traces than ever before. Let’s dig into some examples with a live playground to try it out!

The True Cost of Downtime For Businesses

In this post, we’re sharing some of the best insights from specialists across a variety of industries to answer: What is downtime & why is downtime so detrimental for businesses? As well as answering this key topic we’ll also cover how businesses can take steps to prevent downtime & understand the underlying causes behind this often costly concern. Downtime is a term used to refer to a period of time in which a system, website or service is unavailable to its users.

SAP and Splunk: A Winning Combination

You’re running Splunk — you know how valuable end-to-end visibility saves you both time and money. But...what if you’re running an SAP solution? You’re likely using SAP's Solution Manager to keep an eye on its software, but if Solution Manager sees that HANA is not working, it really can’t tell you why, if the issue is beneath SAP. Splunk and SAP recognized that, and have a shared goal of helping our customers realize the full potential of their data.