Operations | Monitoring | ITSM | DevOps | Cloud

Logging

The latest News and Information on Log Management, Log Analytics and related technologies.

Cloud logging

There’s no tool that can replace the best practices for DevOps or SRE, but there is a tool that can allow you greater observability over your logs in a distributed infrastructure involving multiple products. In this episode of Google Cloud Platform Essentials, we show you how logs are aggregated for all Google Cloud products, how to utilize them, and how to use them for tracking application errors.

New support for HTTP connections

As all Papertrail fans know, sending logs to Papertrail using syslog is quick and easy. Generating and transmitting syslog packets usually involves just 2 – 4 lines of code, and you can see your logs flowing into Papertrail in minutes. There are times, however, when you just can’t use syslog or install a remote_syslog2 daemon. This is where the new support for sending logs via HTTP comes in. And the best news is, it’s just as quick and easy to set up.

Part One: How to Build Monitoring Dashboards based on Grafana with Logz.io

Logz.io customers use our Infrastructure Monitoring product to collect, store, and analyze metrics. In this webinar, Daniel and Noa will explain some of the basics of getting started with the product and cover some recent product additions with Grafana 7.

Heroku Continuous Integration & Deployment with Docker [Hands-On Tutorial]

In this tutorial, we will be using Heroku to deploy our Node.js application through CircleCI using Docker. We will set up Heroku Continuous Integration and Deployment (CI/CD) pipelines using Git as a single source of truth. Containerization allows developers to create and deploy applications faster with a wide range of other benefits like increased security, efficiency, agility to integrate with DevOps pipelines, portability, and scalability.

Announcing new Sumo Logic dashboards

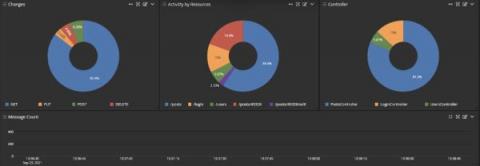
We’re excited to announce the first version release of our new dashboard framework: Dashboard (New). Built on top of a scalable, flexible, and extensible charting system, the new dashboards provide customers with deep control over their visuals, enable metadata rich workflows, and create dashboards in a dashboard first GUI.

Containers, Microservices, and Kubernetes

Faster application development requires more agile application infrastructure. Containers started the transformation of modern application architectures which now are dominated by microservices running on Kubernetes. In this episode of Dissecting DevOps find out how cloud infrastructure has changed, how the modern architectures make application development easier, and the unique challenges introduced by microservices and Kubernetes.

How Do I View My Elasticsearch Mappings?

There are two ways you can view the current mappings on your Logit ELK Stacks. One way is to use dev tools in Kibana. You can access Kibana from any of your dashboards by choosing from your dashboard Stack settings > Access Kibana. You can also search for a specific mapping of an Index name. For example if we wanted to see the mappings for the a Filebeat index name we can run the following to return only the desired mappings.