Operations | Monitoring | ITSM | DevOps | Cloud
The latest News and Information on Log Management, Log Analytics and related technologies.
Asia Pacific Firms Need Analytics to Survive the Cloud Era
Many companies in Asia Pacific (APAC) were caught in a digital tailspin when Covid-19 hit, sacrificing security practices in their hurry to adjust to the new reality of remote work. Two years on, hybrid work is still the norm as the pandemic continues and seems to be a new way of life moving forward. Catalyzed by the coronavirus, firms big and small are now adopting cloud technologies as we tread deeper into a new data age.
Open Source Terraform Module: CloudTrail Logs from S3 to Kinesis Data Streams
We are happy to provide an open-source Terraform module enabling automatic delivery of CloudTrail logs from S3 to a Kinesis Data Stream.
CDN Logs and Why You Need Them
A Content Delivery Network (CDN) is a distributed set of servers that are designed to get your web-based content into the hands of your users as fast as possible. CDNs produce CDN logs that can be analyzed, and this information is invaluable. Why? CDNs host servers all over the world and are designed to help you scale your traffic without maxing out your load balancers. A CDN also gives you added protection against many of the most common cyber attacks. This activity needs to be closely monitored.
What is Splunk? - A Summary for UK Public Sector
To quote the UK National Data Strategy: Splunk is an advanced data platform that delivers right-time analytics from diverse data sets and that enables organisations to ask questions of all their data. It can be used to mitigate cyber security risk, improve performance, increase reliability and observe what is happening in the cloud.
Announcing the Control API Suite
As LogDNA has grown, many of our customers have too, meaning that they are bringing in more ingestion data sources and expanding their use cases for their logs. To help with managing more data, we’re excited to introduce the Control API suite. We’ve built 4 individual APIs that will help companies programmatically configure their data and how they want to ingest logs. Below, we’ll cover each new API in detail as well as why they are massively impactful for our customers.
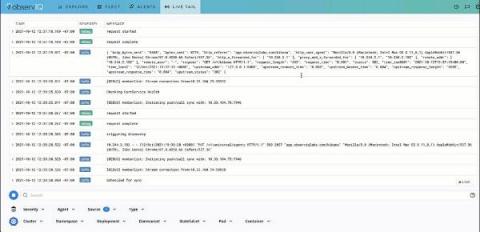
Troubleshooting Pod issues in Kubernetes with Live Tail
With the advent of IaaS (Infrastructure as a service) and IaC (Infrastructure as Code), it is now possible to manage versioning, code reviews, and CI/CD pipelines at the infrastructure level through resource provisioning and on-demand service routing. Kubernetes is the indisputable choice for container orchestration.
Illuminate 2021 - Embracing open standards for big picture observability
Phight the Phish
For today’s remote workforce, security professionals need technical security awareness education distinct from the rest of the company’s “don’t click a phishing link” training. Security analysts know how to recognize phishing emails and set secure passwords. However, where does that leave them when it comes to security awareness month?


