Operations | Monitoring | ITSM | DevOps | Cloud

Logging

The latest News and Information on Log Management, Log Analytics and related technologies.

Embrace Growing and Untapped Data Sources Without Price as a Limitation

At Splunk, we're listening to our customers and offering more predictable, flexible, and familiar pricing options as part of our Data-to-Everything Pricing model. In particular, Splunk’s new infrastructure pricing metric changes the paradigm of how much data you can analyze with Splunk, allowing users to move toward a value-driven pricing model that better aligns what you pay with real value you can extract from using Splunk products.

A Cost Comparison: ELK vs Proprietary Log Analytics

The large volumes of logs, metrics, and traces generated by scaling cloud environments can be overwhelming, but they must be collected to identify and respond to production issues or other signals showing business or application issues. To collect, monitor, and analyze this data, many teams choose between open source or proprietary observability solutions.

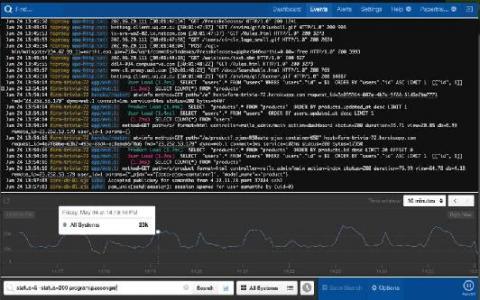
Identifying and monitoring key metrics for your hosts and systems

This post is the first in a three-part series on how to effectively monitor the hosts and systems in your ecosystem, and we're starting with the one you use most: your personal computer. Metrics are a key part of observability, providing insight into the usage of your systems, allowing you to optimize for efficiency and plan for growth. Let's take a look at the different metrics you should be monitoring.

Dynamic presentations with Canvas

Canvas is data visualization and presentation tool that sits within Kibana. It allows us to pull live data directly from Elasticsearch and combine it with colours, images and text in order to create dynamic and visually appealing presentations. This talk will cover the basics of building your first presentation based on the live data from Elasticsearch. If you enjoy immersing yourself in the creative process while applying your technical skills, you should join us for this talk.

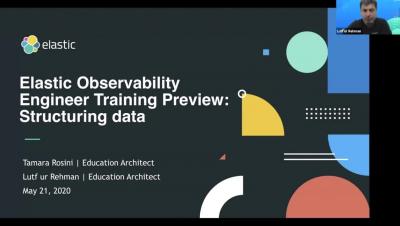
Elastic Observability Engineer Training Preview: Structuring data

Hello! This session will be delivered virtually by Tamara Rosini and Lutf Ur Rehman, Education Engineers at Elastic. They will guide us through the new Elastic Observability Engineer course while providing tips on how to structure data properly as an observability best practice. Properly parsing and structuring your data is an important first step in building an efficient and effective observability solution using the Elastic Stack. Effectively indexing and structuring data into Elasticsearch is critical for establishing efficient search criteria and effective results.

Node.js Logging Guide-Best Tips and Tools to Use in 2020

When applications experience performance issues, developers may rely on heuristics and find the root cause of issues by directly looking into their code. However, in modern application environments, several services, third-party APIs, and cloud-based components can make it difficult to pinpoint the root cause of an issue. Application logs can help developers detect and resolve issues faster.

GrafanaCONline Day 7 recap: The past, present and future of Loki, and making dashboards that tell stories

GrafanaCONline is live! We hope you’re able to check out all of our great online sessions. If you aren’t up-to-date on the presentations, here’s what you missed on day 7 of the conference.