Operations | Monitoring | ITSM | DevOps | Cloud
The latest News and Information on Log Management, Log Analytics and related technologies.
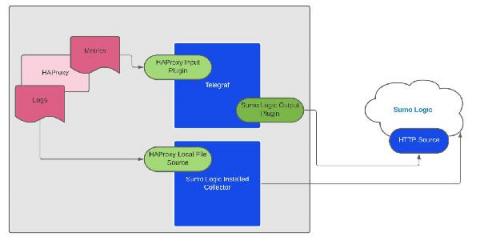
Monitoring HAProxy Logs and Metrics with Sumo Logic
New Logs Screen
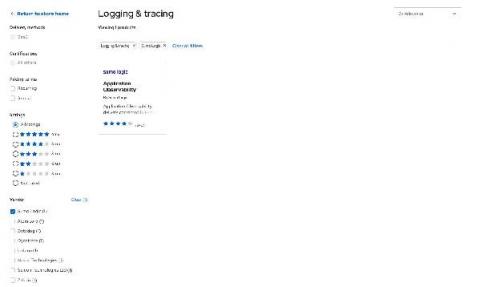
Sumo Logic Red Hat Marketplace Operator
Bolster OT Security with Graylog
Anyone tracking the evolution of the IT industry is probably familiar with the concept of Industry 4.0. Essentially, it describes the process by which traditional industrial tasks become both digitized and continually managed in an IT-like fashion via modern technologies like cloud computing, digital twins, Internet of Things (IoT) sensorization, and artificial intelligence/machine learning.
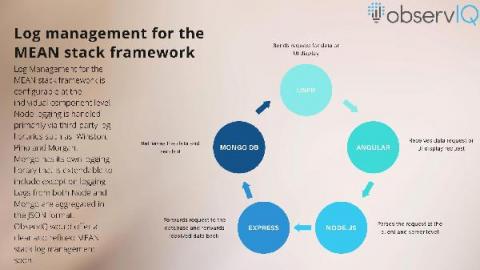
Log Management for the MEAN Stack Framework
MEAN is evolving as a popular web stack for developing cloud native applications because of its scalability, ease of extension, and high reliability. Each component in MEAN is built on JavaScript, contributing to a cohesive development platform. In this post, we take you through the log management options that are available for each component of the MEAN stack framework and their respective limitations – limitations that are addressable with a refined log management solution like observIQ.
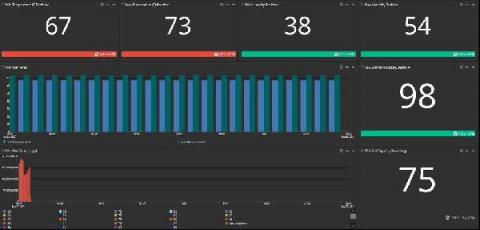
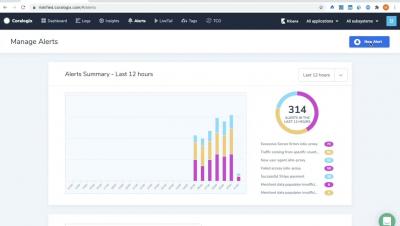
Metric Alerts
Robotic Data Automation (RDA): Reducing Costs and Improving Efficiencies of Your Log Management Investment
Query your nginx/envoy/syslog logs easier and way faster with the new Grafana Loki pattern parser.
Logging Best Practices: Knowing What to Log
First of all, don’t ask this! Instead of asking what to log, we should start by asking “what questions do we want to answer?” Then, we can determine which data needs to be logged in order to best answer these questions. Once a question comes up, we can answer it using only the data and knowledge that we have on hand. In emergent situations such as an unforeseen system failure, we cannot change the system to log new data to answer questions about the current state of the system.


