Operations | Monitoring | ITSM | DevOps | Cloud
The latest News and Information on Log Management, Log Analytics and related technologies.
Tutorial: Set Up a Windows JSON Source
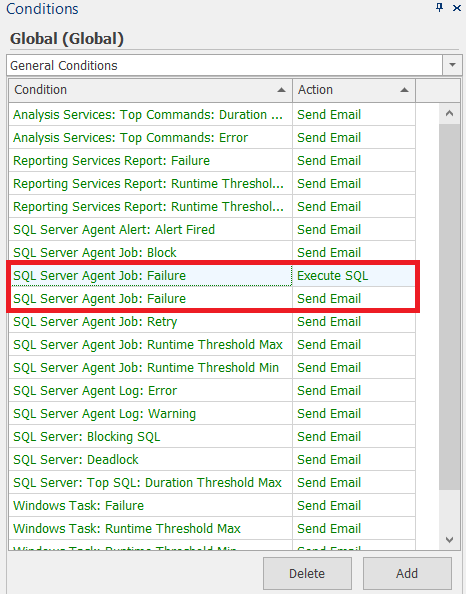
SQL Sentry Events Log Updates Provide a Centralized View of Events
Elastic + Grafana Labs partner on the official Grafana Elasticsearch plugin
Today, I’m happy to share more about our partnership and commitment to our users that they will have the best possible experience of both Elasticsearch and Grafana, across the full breadth of Elasticsearch functionality, with dedicated engineering from both Grafana Labs and Elastic. Through joint development of the official Grafana Elasticsearch plugin users can combine the benefits of Grafana’s visualization platform with the full capabilities of Elasticsearch.
A Picture is Worth a Thousand Logs
Splunk is a fantastic platform for ingesting, storing, searching and analysing data from logs, metrics and traces from a massive variety of sources. But does that mean we should ignore all of that data that doesn’t fall into these categories, like image and video data for example? Of course not!
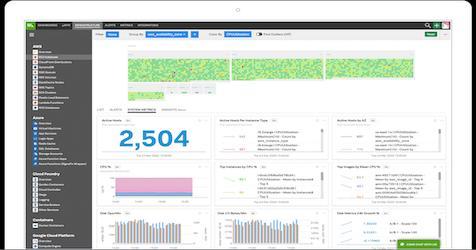
Observability and Monitoring for Modern Applications
I drive a 2005 Ford diesel pickup truck. Most of the time my truck runs great. But occasionally an orange light on the dashboard will flicker on to alert me that something is wrong. Unfortunately, there’s no information about what is wrong and why. My truck has a monitoring solution, but not an observability solution. In many cases, IT has the same problem as my truck.
Observability vs. Monitoring: What's the Difference?
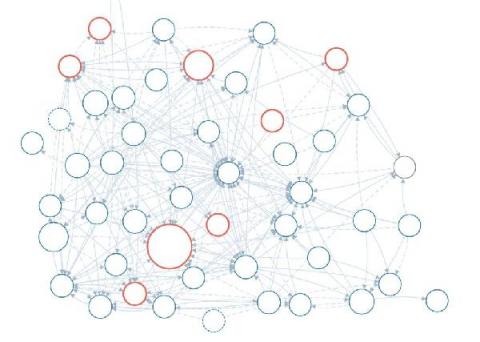
Service Map & Dashboards Provide Insight into Health and Dependencies of Microservice Architecture
Centralized Log Management for Cloud Streamlines Root Cause Analysis
Cloud services make the daily tasks of business easier. They enable remote workforce collaboration, streamline administrative tasks, and reduce capital costs. However, these “pros” come with a few “cons.” The IT stack’s increased complexity means staff work across divergent log management tools when something breaks. Centralized log management for the cloud makes root cause analysis easier by aggregating all event log data in a single location.
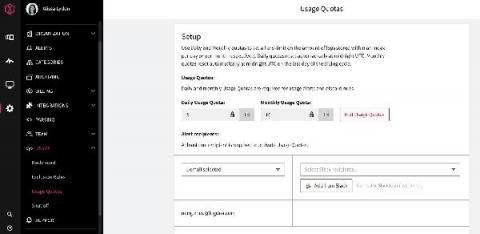
Control Your Logging Spend With Usage Quotas
We built LogDNA around the idea that developers are more productive when they have access to all of the logs they need, when they need them. However, we also know that log management can get expensive fast. And, for anyone who owns the budget for developer tools, logs can be an unpredictable line item as you try to determine your monthly, quarterly or even annual spend.


