"Managing OpenTelemetry Through the OpAMP Protocol" by Mike Kelly, observIQ
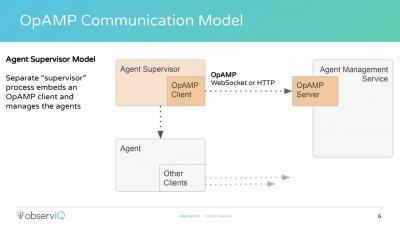
Managing thousands of data collection Agents across just as many servers can overwhelm DevOps teams. Open Agent Management Protocol (OpAMP) is a new network protocol from the OpenTelemetry Project that enables remote management of OpenTelemetry collectors, allowing them to report their status to and receive configuration from a Server and to receive agent package updates from the server. This eliminates the need to create new custom distributions and redeploy, drastically simplifying Agent management.