Operations | Monitoring | ITSM | DevOps | Cloud
Monitoring
The latest News and Information on Monitoring for Websites, Applications, APIs, Infrastructure, and other technologies.
Top Events You Should Always Audit & Monitor
Anybody who’s looked for answers on the Internet has likely stumbled across a “TOP X LISTS”: The “10 things famous people do every day”, “Top 10 stocks to by”, the “20 books you have to read” are just some examples of the myriad of lists that are out there offering answers. You may have even stumbled upon a few “Top 10 (or 12) Events To Monitor” articles too.
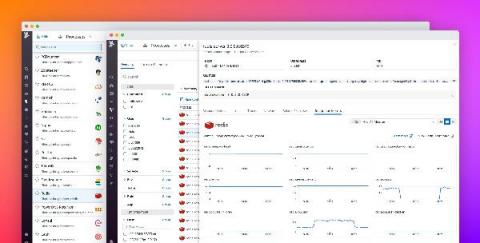
Correlate software performance and resource consumption with new saved views in Live Processes
Your applications rely on third-party software running throughout your infrastructure, and it can be challenging to monitor each of these technologies individually. To give you the visibility you need, Datadog Live Processes now monitors all of your third-party workloads in one place.
Add Datadog monitoring to your Retool apps
The more tools that your teams need to execute their workflows, the more friction and lost productivity there can be, especially if each tool requires a different CLI or set of APIs. Retool is a low-code platform that allows you to build internal web applications using a drag-and-drop interface. By integrating with a number of key backend databases and APIs, Retool enables you to create custom, centralized management tools to serve a wide range of employee-facing use cases.
Two months in: How the SaaS that was built in 7 days is going
In case you don't remember, or missed my first article: OnlineOrNot started as a SaaS I built and shipped a v0.0.1 of in 7 days. It was an Absolute Minimal Viable Product. You couldn't even login with a password. Still can't, actually. You're probably wondering what it does. OnlineOrNot is a website monitoring service that provides both uptime, and page speed checks.
How to check if an item is back in stock?
Are you one of those trying to desperately get your hands on a new RTX 3080, 3070, 3060 Ti, & 3090 in 2021? Or maybe you prefer the new PlayStation 5 or Xbox Series X console. Basically, any item that’s on pre-sale or hard to get (including the uniquely designed piece of clothing for your girlfriend). If your favorite e-shop doesn’t have a “watchdog”, we have the best solution for you. Now how would you know it’s already back in stock? There’s an easy way!
How to deploy Pandora FMS agent in Cloud environments
How to correlate Graphite metrics and Loki logs
Grafana Explore makes correlating metrics and logs easy. Prometheus queries are automatically transformed into Loki queries . And we will be extending this feature in Grafana 8.0 to support smooth logs correlation not only from Prometheus, but also from Graphite metrics. Prometheus and Loki have almost the same query syntax, so transforming between them is very natural. However, Graphite syntax for queries is different, and in order to map it to Loki, some extra setup is required.
Supporting Native Android Libraries Loaded From APKs
Like mechanics who restore their own cars or plastic surgeons who self-rhinoplasty, our developers put their skills to interesting uses during their free time. Here, Native Platform Engineer, Arpad Borsos breaks down how memory mappings and dynamic library loading works and how it relates to native Android libraries loaded from APKs. Libraries are key to modular programming, as they offer functionality in a single unit which can be shared with other developers.
The journey to AIOps begins with an automation-first mindset
AIOps isn’t an IT magic wand, but it sometimes works like one. One day last fall, our IT ops team was heads down on a major cloud migration project. Meanwhile, ServiceNow Event Management detected a high volume of alerts from the monitoring system—600% more than usual. That typically means a lot of unplanned work for our IT team, not to mention a delay in our cloud migration schedule.


