Operations | Monitoring | ITSM | DevOps | Cloud
Monitoring
The latest News and Information on Monitoring for Websites, Applications, APIs, Infrastructure, and other technologies.
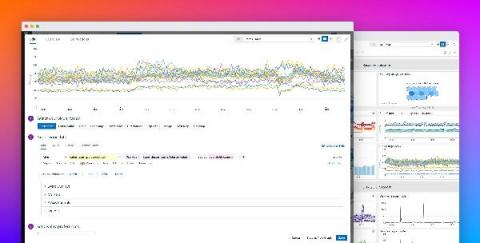
Speed up your dashboard workflow with dynamic template variable syntax
Template variables enable you to use tags to filter your Datadog dashboards to the hosts, containers, or services you need for faster troubleshooting. However, there are some cases where it may be difficult to use a standard set of template variables to aggregate all of the data you need without creating a complicated, difficult to manage set of variables. For example, you may use tag values that are a subset of another tag.
Upgrading and Patching WLSDM
WLSDM new releases and updates come continuously, which will transform WLSDM into a unique viewing experience after upgrade. New update with ease of use and bug fixes; It brings the native WebLogic viewing experience offered to date to better levels. By upgrading the current WLSDM version, you can continue to use the WLSDM capabilities you are used to with the latest version.
No-code Lambda Monitoring
Auto-instrumenting Lambda Monitoring didn’t originate through a focus group or business plan. It started as a hackathon project in which our growth team used Cloudwatch to build a prototype that could instrument Lambda functions with Sentry. We did this by using Cloudformation’s stack to automatically create resources in a customer environment while streaming CloudWatch Logs to Sentry through the Kinesis Firehose.
Rethinking Anomaly Detection
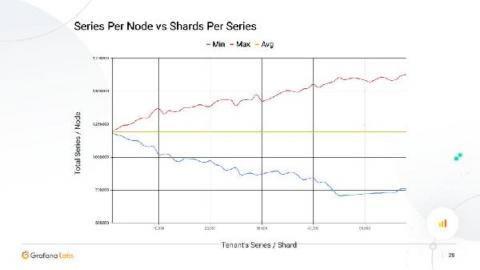
How shuffle sharding in Cortex leads to better scalability and more isolation for Prometheus
For many years, it has been possible to scale Cortex clusters to hundreds of replicas. The relatively simple Dynamo-style replication relies on quorum consistency for reads and writes. But as such, more than a single replica failure can lead to an outage for all tenants. Shuffle sharding solves that issue by automatically picking a random “replica set” for each tenant, allowing you to isolate tenants and reduce the chance of an outage.
Observability: It's the User Experience, Stupid!
Observability, which originated from control theory, measures how well you can understand a system’s internal states from its external outputs. Observability uses instrumentation to provide insights that aid monitoring. In DevOps, gaining observability is achieved through a set of monitoring solutions. The shift to use one vendor platform to do so, versus multiple solutions, make sense as.
David Henthorn | Illuminating the Dark Data of Critical Infrastructure | InfluxDays EMEA 2021
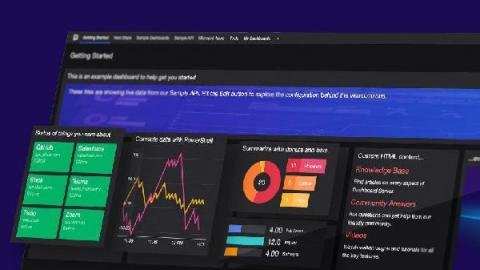
Dashboard Server: Working with the Elasticsearch Tile
I’ll come clean and admit it – this part of the series will be a bit interesting given the fact that I know very little about Elasticsearch. So really, this is an honest test of the question – “can I still build something good with Dashboard Server even if I only have nominal knowledge of the tool where the data is sourced from?”


