Operations | Monitoring | ITSM | DevOps | Cloud
Monitoring
The latest News and Information on Monitoring for Websites, Applications, APIs, Infrastructure, and other technologies.
How to Improve Core Web Vital Scores
From May 2021, Google is using ‘Core Web Vitals’ as a brand new ranking signal. Google states that business owners should monitor and improve their scores to avoid damaging their organic SEO. In this blog, we will explain how to improve Core Web Vitals scores. To discover the specific issues affecting your users’ experience, we strongly advise having a Core Web Vitals audit.
Welcome to Virtana Migrate
Industry First! Citrix IT Pros can Now Solve Remote Worker Issues
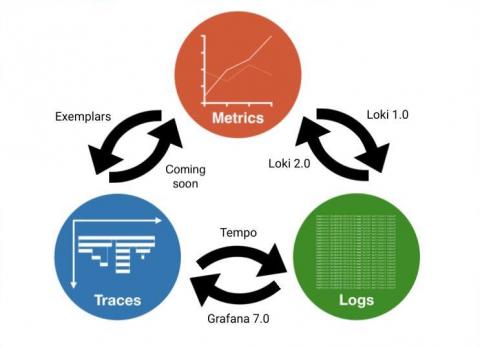
Intro to exemplars, which enable Grafana Tempo's distributed tracing at massive scale
Exemplars are a hot topic in observability recently, and for good reason. Similarly to how Prometheus disrupted the cost structure of storing metrics at scale beginning in 2012 and for real in 2015, and how Grafana Loki disrupted the cost structure of storing logs at scale in 2018, exemplars are doing the same to traces. To understand why, let’s look at both the history of observability in the cloud native ecosystem, and what optimizations exemplars enable.
Getting started with Dashboard Server
SquaredUp Dashboard Server lets you and your team create beautiful dashboards, for any tool or data, that you can share with everyone in your organization. Here’s a quick introduction to the product where we show you exactly what you can achieve, in no time at all. Let’s start with the three tabs on the top left of the screen: Getting Started, Next Steps, and Sample Dashboards. We’ll run through them one by one.
Secure By Design | Securing the Supply Chain
How to monitor Redis with Bleemeo?
This article describes how to monitor a (cluster of) redis server. Bleemeo will detects automatically the redis server (it can runs in a Docker container or directly on the host) and create automatically a service dashboard. This article will also covers creating a custom dashboard with additional metrics.


