Operations | Monitoring | ITSM | DevOps | Cloud

Monitoring

The latest News and Information on Monitoring for Websites, Applications, APIs, Infrastructure, and other technologies.

4 Tips for a Productive Digital Workplace

What does a productive digital workplace look like? For many companies, that question isn’t easy to answer. Even before 2020, enterprise business leaders have been exploring the many benefits of bolstering their digital workplaces with smart technologies and IT practices. That last figure is particularly revealing: almost all businesses are aware of the importance of digital workplaces, but less than half are taking steps to create an effective one.

What Should You Do When You Receive Event Log Monitor Alerts?

When you are installing PA Server Monitor, you will need to configure what occurs when there are event log monitor alerts. You typically set this up during the initial install. However, it is not uncommon to want to make changes and updates or even add new events to your server monitoring software as you become more familiar with it.

Monitoring Your Website's Accessibility

Web accessibility is a vital aspect of search engine optimization (SEO) and overall user experience (UX). Maximizing the effectiveness of both is dependent upon how accessible your site is. With 5G wireless technology changing the expectations of website monitoring, you need to be even more aware of how accessibility influences your results. Tracking web accessibility metrics doesn't have to be complicated.

Collect Amazon CloudWatch metrics faster with Datadog using CloudWatch Metric Streams

Having quick access to metrics and health signals from your AWS environment is paramount to identifying issues expediently and monitoring the effects of any deployed fixes. Datadog is proud to partner with AWS for the launch of CloudWatch Metric Streams, a new feature that allows AWS users to forward metrics from key AWS services to different endpoints, including Datadog, via Amazon Kinesis Data Firehose with low latency.

ITOM vs ITSM

Is it important to your customer to understand the distinction between IT Operations Management (ITOM) and IT Service Management (ITSM)? Most likely not. Your customers are only concerned with how quickly you solve their problems. It makes no difference to them which application or infrastructure you use. So why should you, as an organization, be concerned about the meaning of these concepts, how they align, how they differ, and why they matter?

Exposing More Public Endpoints for Sending Metrics and Errors to AppSignal

Today, we launch a new feature: sending metrics and errors to AppSignal over our “Public Endpoint” API. AppSignal has many web frameworks, databases and background job frameworks automatically instrumented when you want to monitor a Node.js, Ruby or Elixir app. If you have code running on serverless architecture such as AWS Lambda, you can’t run our agent, so our standard integration with all of the out-of-the-box magic won’t work.

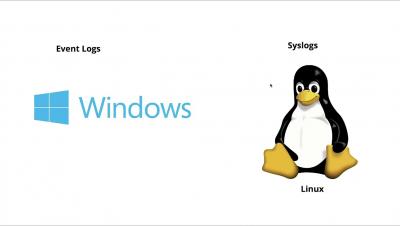
Resource check profile - Monitor Windows event logs and Linux syslogs

Monitor the internal resources in your server such as event logs and syslogs to monitor specific events across all Windows and Linux servers. Internet-facing systems constantly confront the risk of security hacks and data theft. While you're monitoring key performance metrics of your servers, keeping an eye out for security incidents is also necessary. This can be achieved through event log monitoring for Windows servers, and syslog monitoring for Linux servers.

Monitoring critical windows services and processes

Along with server performance metrics, such as CPU, disk, and memory usage, it is important to monitor the performance of each service and process running on the server to completely analyze the load on the system resources. This video shows how Site24x7 helps you achieve that. Say you're monitoring a Windows server with Site24x7. Along with tracking the performance metrics of the server, you can also track the performance of critical services like MySQL, Apache, and PostgreSQL, and processes like redis-server.exe.

Monitor dependency and alert suppression

A network outage triggers multiple redundant alerts and burns out your alert balance. Site24x7's monitor dependency configuration helps you effectively handle the alert flood during an outage. Let's say you're monitoring your server with Site24x7, along with a few plugins hosted in it. Any downtime faced by the server will also affect the plugins, resulting in a flood of alerts for the server and the individual plugins.

Comparing Real User Monitoring and Synthetic Transactions

Written by Nick Cavalancia, Microsoft Cloud & Datacenter MVP The need for visibility into service availability and delivery quality has led to the rise in interest in monitoring Microsoft’s Office 365 services from the user perspective. With two different approaches available, what value do they each bring?