Operations | Monitoring | ITSM | DevOps | Cloud


The latest News and Information on Monitoring for Websites, Applications, APIs, Infrastructure, and other technologies.

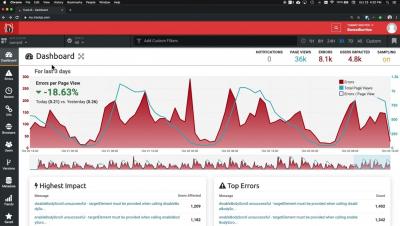
A Quick Introduction to TrackJS

Monitoring your Windows performance metrics with hosted Graphite
Windows is the most popular operating system in the world. It powers not only personal computers and laptops at home but also enterprise servers and systems. Due to the vast use of the software, many solutions to monitor Windows have been developed. In this article, we will discuss an efficient way to monitor Windows and the reason why we want to track the metrics of the operating system. But before we start, check MetricFire.

Proactively Deliver a Better Microsoft Teams Experience
Legendary wine and spirit merchants Berry Brothers & Rudd arm their IT team with deep Microsoft Teams visibility to speed issue resolution and deliver an exceptional user experience. Berry Bros. & Rudd (BBR) is a family-run British wine and spirits merchant founded in London in 1698. Over the years, the company has grown to include six offices worldwide, including Japan, Singapore and Hong Kong.

Learn Effective Policy Compliance Management with Restorepoint
In the two previous blogs from this series, we showed you how Restorepoint enables you to minimize MTTR to mitigate the impact of change management and remediate after a network breach. The third and final blog of the series walks you through policy compliance management—demonstrating the value of creating a single pane of glass where you can see all relevant information from a single location.

Market Trends And Predictions For 2022

Going On Call for the First Time
I've never been on call before, and I'm not sure what to expect, or how I can best prepare for it. Will I need to upend my life just in case the pager goes off? And how should I best cope with getting paged? I've read Charity's piece on the opposite problem of wanting to stop being on call, but it didn't quite answer my question.

10 Web Monitoring Tips for Redundant Systems
As your team grows, so do the rules and regulations you use to keep things organized. The same is true for systems, which grow in complexity as they grow in size. That complexity is difficult to manage on its own without the natural turnover that occurs in tech. Those who built and managed legacy systems, eventually go on to bigger and brighter things, either within the company or toward other opportunities.

Why and how to monitor Amazon API Gateway HTTP APIs
API gateways are part of every modern microservice architecture. As their name already suggests, they are the gateway into your system; everyone who wants to access your service has to go through a gateway. In 2019, AWS announced HTTP APIs for its API Gateway (APIG) service. This was a big step to add more flexibility and lower latency to APIG. Before this release, you could only build REST APIs with APIG, which only helped when you wanted to create an API based on the REST architecture.

Announcing Logz.io Alert Manager for Metrics
Logz.io alerts are a critical capability for our customers monitoring their production environment. By keeping a watchful eye for data that indicates an issue – like spiking memory metrics or 3xx-4xx response codes – alerting quickly notifies engineers that something is going wrong. Setting an actionable alert to immediately notify engineers of oncoming problems can be the difference between a minor issue and a major event with widespread customer impact.