Operations | Monitoring | ITSM | DevOps | Cloud

Monitoring

The latest News and Information on Monitoring for Websites, Applications, APIs, Infrastructure, and other technologies.

Personalized IT: What Every Tech Dept. Needs To Know

The top priority of a typical IT team has remained relatively unchanged for decades: provide support for employees and make their user experiences as smooth as possible. With that being said, the actual workflow of an IT team looks nothing like it did years ago — because the way employees work on a day-to-day basis has drastically changed.

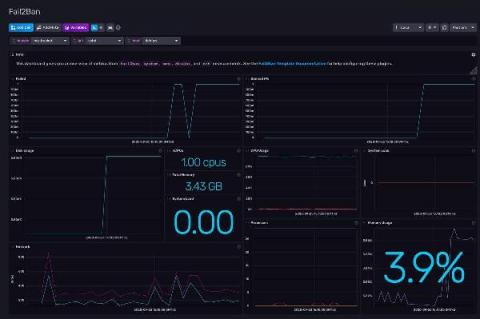
Fail2ban Monitoring with InfluxDB and Telegraf

If you have a server open to the internet on Port 22 (the default port for SSH servers), it’s common to find several “Failed password” in your auth.log (log file) every minute, due to bots constantly browsing the internet for servers that are easy to hack with common passwords. But if your auth.log is growing very fast and SSH daemon randomly refuses to create new connections, then someone probably marked your server as a target for coordinated SSH brute-force attack.

AppSignal for Elixir Integration 2.1 Released

We’re happy to announce the release of AppSignal for Elixir 2.1.0. 🥳 In this version, we’ve made our error helpers more flexible than before. You could already send Elixir exceptions directly through AppSignal and now you can add extra metadata to errors when using send_error/2-4. Let’s go through all of the changes 😀

Monitoring Tools for MSP: Things to Consider

Monitoring is a major part of a Managed Service Provider or MSP. After all, it emerged as remote management and monitoring (RMM) of servers. However, today MSP’s scope is well-defined and distinguished from standard RMMs. Nevertheless, monitoring is still a key service that these companies provide to their clients. Managed service providers take care of all the IT infrastructure of their clients.

How to monitor your AWS servers via MetricFire

In this article we explore the basics of monitoring Amazon Web Services (AWS) by feeding metrics to Grafana through Hosted Graphite’s agent and also through Hosted Graphite’s AWS add-on. This will allow us to monitor metrics from applications and servers hosted in AWS with clarity and depth. This article assumes you have created a Hosted Graphite account.

Better Dashboarding - Grafana or SquaredUp?

As part of my job as a tech evangelist and a pre-sales engineer here at SquaredUp, I often find myself talking to a lot of people. And understandably, when you as a consumer are trying to evaluate a product that you may potentially invest in, it’s only natural that you want to compare different products and decide which one’s better and/or offers more value for money and why.

A Practical Guide to Logstash: Input Plugins

In a previous post, we went through a few input plugins like the file input plugin, the TCP/UDP input plugins, etc for collecting data using Logstash. In this post, we will see a few more useful input plugins like the HTTP, HTTP poller, dead letter queue, twitter input plugins, and see how these input plugins work.

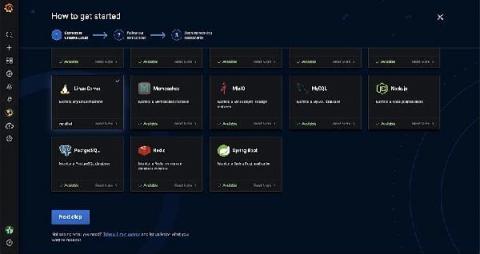
How to connect and monitor your Raspberry Pi with Grafana Cloud

The Raspberry Pi is a popular and inexpensive device that comes in many shapes and forms. It’s a popular hobbyist tool that is generally purchased to run all kinds of software experiments on. But make no mistake, even though a Raspberry Pi comes in a tiny form factor, it’s a fully functional computer!