Operations | Monitoring | ITSM | DevOps | Cloud
Monitoring
The latest News and Information on Monitoring for Websites, Applications, APIs, Infrastructure, and other technologies.
Level Up 2020 Highlights
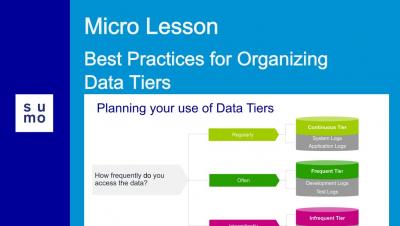
Micro Lesson: Best Practices for Organizing Data Tiers
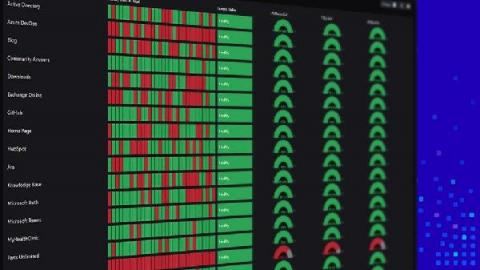
Building powerful tailored SCOM dashboards with Enterprise Applications (Part 1)
In my position, I get to work with a wide variety of organizations that each have a different level of monitoring maturity. But I’ve noticed an emerging pattern that I’ll call the ‘Critical Service Offering’ or ‘Executive Level Status’ dashboard. At their most basic level, these dashboards should communicate the current health of the application, provide some historical context and, most importantly, not be tied to infrastructure monitoring.
Troubleshooting Kubernetes Job Queues on DigitalOcean, Part 2
Top 10 Metrics to Track when Monitoring Microsoft IIS Performance
Microsoft Internet Information Services (IIS, formerly known as Internet Information Server) is an extensible web server software created by Microsoft for use with the Windows family. IIS supports various protocols, including HTTP, HTTP/2, HTTPS, FTP, FTPS, SMTP, and NNTP. According to the most recent ranking by W3Techs, Microsoft IIS is the second most popular web server technology behind Apache.
How to Save Hundreds of Hours on Lambda Debugging
Although AWS Lambda is a blessing from the infrastructure perspective, while using it, we still have to face perhaps the least-wanted part of software development: debugging. In order to fix issues, we need to know what is causing them. In AWS Lambda that can be a curse. But we have a solution that could save you dozens of hours of time. TL;DR: Dashbird offers a shortcut to everything presented in this article.
Get to Know Splunk Machine Learning Environment (SMLE)
One of our most exciting new projects at Splunk is coming to life. Over the past year, we have been hard at work putting together our vision: a place where Splunk admins, NOC/SOC teams, data analysts, and data scientists can collaborate, experiment, and operationalize their work, all in a single environment inside the Splunk ecosystem. We call it Splunk Machine Learning Environment (SMLE).
Best Website Performance Testing Tools
What is the usual criteria in choosing an online store? It should have reasonable prices, sell quality products, and most of all, it should have a fast loading time. A website’s performance is essential. A two-second delay can make a big difference to your website and revenue as well. In fact, Neil Patel reported that a mere second delay may cost an e-commerce site up to $2.5 million in sales annually.
The Spectre of Shadow IT
“What’s that? You want me to send you a large video file or something? No, that’s not a problem, it’s actually easy, I’ll just stick it on Box. Or DropBox, or stick it on WeTransfer and then we’ll do a quick Zoom to go through it – what?


