Operations | Monitoring | ITSM | DevOps | Cloud

Monitoring

The latest News and Information on Monitoring for Websites, Applications, APIs, Infrastructure, and other technologies.

Monitor Azure IoT Edge with Datadog

Azure IoT Edge is a Microsoft Azure service that allows you to run containerized workloads on IoT devices. With IoT Edge and Azure IoT Hub, Azure’s device-management platform, organizations across science, manufacturing, energy production, and other industries can provision their IoT devices and workloads at the edge of their cloud networks for immediate in-unit computing, a necessity when running AI algorithms or parsing large datasets directly on IoT devices.

7 Practical Problem Management Techniques to Improve Your Service Delivery

All IT support teams know that problem management is used to identify the root causes which help to permanently resolve recurring incidents and follows specific steps like: However, problem management still remains an underrated, underutilized process which is mostly used together with incident or change management process. Problem management, out of all the ITSM processes has one of the lowest adoption rates.

Barriers to DevSecOps Adoption

DevSecOps — or the merging of Ops and Security — has been at the center of discussion for the better part of the outgoing decade. Today, the complexity of infrastructure change, demands security and DevOps teams to work together more efficiently. But there are hurdles to adoption of DevSecOps as a methodology. Cloud-native applications often live in multiple clouds across data centers, co-location, and public clouds.

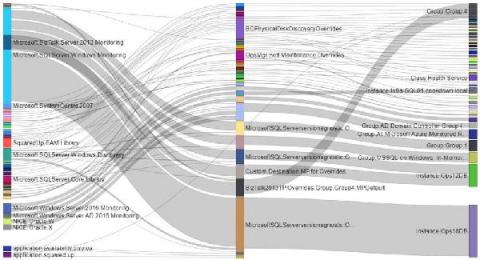
Download PowerBI Diagram for visualizing overrides using Sankey

Did you catch our recent webinar on how PowerBI makes it possible to visualize override sprawl in SCOM with Sankey Diagrams and want to give our Sankey diagrams a go yourself? You are in the right place. Before you dive in, take a look at our blog explaining the “why” to using Sankey PowerBI diagrams to see your overrides, and how to take action based on what you see here.

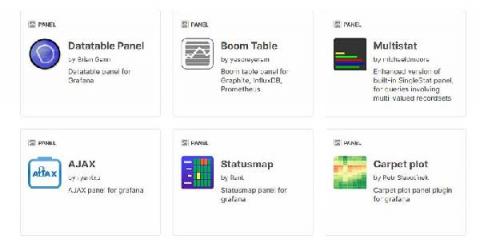
6 tips for improving your Grafana plugin before you publish

Are you putting the final touches on your plugin before you submit it to the Grafana plugin page? In this article, I’ll share a few tips for how to add that extra polish to your plugins. This article assumes that you already have some knowledge of building plugins for Grafana. If you’re looking to build your first plugin, start by following one of our plugin tutorials.

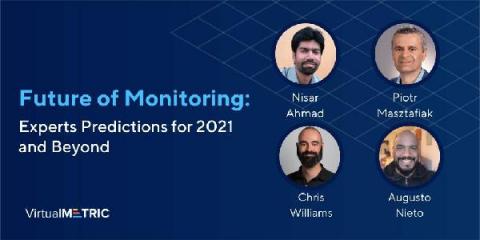
Future of Monitoring: Experts Predictions for 2021 and Beyond

Making predictions is a tricky business at the best of times, but especially after a year that turned the world upside down. Even so, we have decided to talk to the IT leaders and discover what we should get ready for in 2021. With technology development, COVID-19 impact, and the new cybersecurity issues happening in the world, the IT engineers responsible for the IT infrastructure monitoring should be always ready to adapt to the new challenges.

Actionable alerts with fewer false positives: intelligent alarms with Netdata

Think about any sport or competitive activity, whether that’s football or a spelling bee. They always feature at least one person who acts as a moderator, referee, or judge. With their domain expertise, this person watches everyone’s behavior and constantly compares that against a set of rules. If someone crosses that threshold, they blow a whistle or throw up a flag. They are, in effect, saying that things have gone from OK to not OK.

Top 10 APM Tools in 2021 As Per G2 Ratings

In this information technology era, Application Performance Management (APM) monitors the performance of software applications and identifies the problems related to application performance as a service to the users. APM can be monitored or tracked using categories like load time, the response time of the application, etc. Nowadays, the applications are becoming more and more complex and distributed by using some technology in it.