Operations | Monitoring | ITSM | DevOps | Cloud

Monitoring

The latest News and Information on Monitoring for Websites, Applications, APIs, Infrastructure, and other technologies.

Introducing IPHost mobile client

We are glad to introduce IPHost mobile app (currently available for Android 4.4 or newer). To start using Push notifications on your Android device(s), please upgrade your IPHost installation to v5.3 or later version. You would also need an Android mobile device running free IPHost mobile app. We have added a quick start reference for IPHost mobile app; it typically takes less than 5 minutes to install the app, connect it to the IPHost desktop installation and commence receiving Push notifications.

Node.js Garbage Collection: Heap Statistics Magic Dashboard

We just released a Magic Dashboard for Garbage Collection stats for our Node.js integration. If you are leaking memory, this dashboard will help you discover and fix this problem. No setting up is required, this dashboard will magically automatically appear among the rest of your dashboards. ✨

How to collect HAProxy metrics

This article is a full tutorial on HAProxy monitoring and the best tools to get it done right. We will be looking into how to collect HAProxy metrics using a collectd daemon, push them into Graphite and visualize them in Grafana. To follow the steps in this blog, sign up for the MetricFire free trial, where you can use Graphite and Grafana directly in our platform.

How Common Application Issues Kill Performance

In the modern era of digital businesses, web applications need to deliver on several grounds–performance, user experience, robustness, and scalability. However, many developers might agree that performance is of the utmost importance in any software application. The bells and whistles of a fancy UI and extensive functionalities can sometimes force performance to take the back seat. Additionally, there are a lot of reasons for performance to degrade over time.

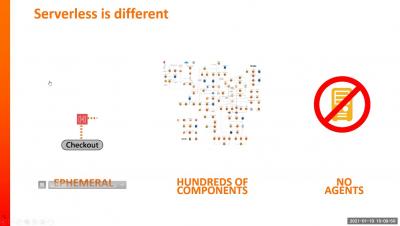
Webinar How to Monitor Serverless Apps - Jan 2021

The software we write does not always work as smoothly as we'd like. To know if something went wrong, find the root cause, and fix the problem, we need to monitor our system and get alerts whenever issues pop up. There are many useful tools and practices for non-serverless applications. As we adopt serverless architecture can we continue to use the same approach? Unfortunately, the answer is no.

A Practical Guide to Logstash: Parsing Common Log Patterns with Grok

In a previous post, we explored the basic concepts behind using Grok patterns with Logstash to parse files. We saw how versatile this combo is and how it can be adapted to process almost anything we want to throw at it. But the first few times you use something, it can be hard to figure out how to configure for your specific use case.