Operations | Monitoring | ITSM | DevOps | Cloud

Monitoring

The latest News and Information on Monitoring for Websites, Applications, APIs, Infrastructure, and other technologies.

How PlayStation Network monitors its global systems with Datadog

The PlayStation Network, with over 94 million users, was a complex, microservices-linked system that was difficult to manage, distributed among three locations in Tokyo, San Diego and San Francisco. With Datadog's host map and APM, the system can now operate organically together.

Ask the Citrix Expert How to Troubleshoot Citrix Issues for Remote Workers

In this “Ask the Expert” session we will be talking with Citrix CTP, George Spiers, who will answer your questions around: How can you prove root cause is due to a user's home WIFI, behavior, or an issue within the virtual infrastructure? How do you find root cause of slow logons or poor session performance? And how can you report on remote worker productivity?

Monitoring as code with Sensu Go 6

A comprehensive CI/CD initiative should include monitoring and observability. Monitoring as code incorporates the active monitoring of the infrastructure under management, creating a symbiotic relationship in which new metrics and failures are collected and detected automatically in response to code changes and new deployments. Monitoring as code is the key to this unified view of the world and management of the entire application lifecycle.

Cloud Profiler provides app performance insights, without the overhead

Do you have an application that’s a little… sluggish? Cloud Profiler, Google Cloud’s continuous application profiling tool, can quickly find poor performing code that slows your app performance and drives up your compute bill. In fact, by helping you find the source of memory leaks and other errors, Profiler has helped some of Google Cloud’s largest accounts reduce their CPU consumption by double-digit percentage points.

Walking Through a Call From Pingdom Alert to DigitalOcean Managed Kubernetes

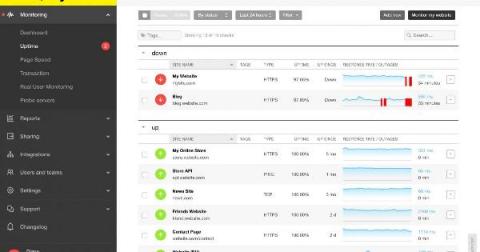
SolarWinds® Pingdom® is an external synthetic monitoring agent designed to monitor your systems from the outside in. If you know what clues to look for, it can provide a great place to triage where a problem is occurring in the system. So how does a Pingdom call work, and how can you use it to debug what’s happening inside the system?

Correlating Pingdom Alerts With AppOptics and Loggly in DigitalOcean Kubernetes

So SolarWinds® Pingdom® has alerted you to an issue—what do you do now? In this article, I’ll explain the features and capabilities of a full monitoring stack in SolarWinds and how you can use it to get to the bottom of a 3 a.m. Pingdom wake-up call. The Setup For our web service, we use a simple architecture of a front-end Flask application with a Postgres back end served behind an edge SSL-terminating NGINX instance on the DigitalOcean Managed Kubernetes service.