Operations | Monitoring | ITSM | DevOps | Cloud

Monitoring

The latest News and Information on Monitoring for Websites, Applications, APIs, Infrastructure, and other technologies.

Best Practices for Incident Management: A Checklist

If productivity is the engine that helps optimize how a business operates then being proactive is the oil and knowing how to effectively maintain productivity is regularly checking and replacing said oil. Whenever a service outage occurs it throws a wrench into the whole process and can put an entire organization in flux, mainly because the outage.

Martello in Motion - Rapid Circle

Rapid Circle has been providing information and communication technology services to organizations since 2008. The company offers cloud workplace and managed cloud services like data center migration, adoption and change management, and other cloud solutions that help organizations cut costs, improve productivity, and contribute to innovation, internal communication, and collaboration.

How Prometheus monitoring mixins can make effective observability strategies accessible to all

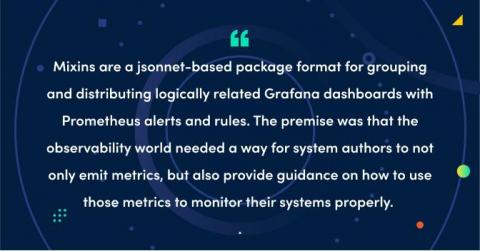
Three years ago, Tom Wilkie and Frederic Branczyk sketched out the idea for Prometheus monitoring mixins. This is a jsonnet-based package format for grouping and distributing logically related Grafana dashboards with Prometheus alerts and rules. The premise was that the observability world needed a way for system authors to not only emit metrics, but also provide guidance on how to use those metrics to monitor their systems properly.

Building a GitOps Workflow

Since the rise of Kubernetes, GitOps workflows have become the standard way for teams to manage the state of large systems. GitOps is a way to perform application management and delivery, which at its core leverages a version control system to maintain the desired state of the system. Being able to describe the desired state using human readable text files, and allowing automation to handle deployments and updates based on those files, means less opportunity for human error and faster deployments.

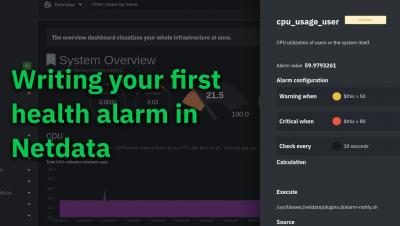
Creating your first health alarm in Netdata

The per-second metrics and interactive visualizations in the Netdata Agent don’t mean much if you don’t know what you should be looking at, or whether anything is going wrong on your node in the first place. That’s why Netdata has a built-in health watchdog to notify you when metrics show an anomaly or full-blown incident that demands your immediate attention. Every Netdata Agent comes with hundreds of preconfigured charts that you don’t need to edit in order to take advantage of, but you may want to create your own based on your infrastructure, node, workload, or applications.

Healthcare IT responds to pandemic with increased focus on database monitoring and the cloud

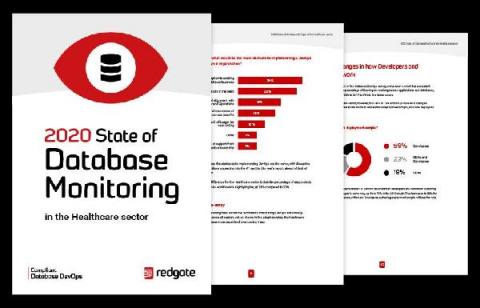
Every year, Redgate’s State of Database Monitoring Report reveals how businesses and organizations are monitoring their database estates. Are they using in-house or third-party monitoring tools? Who has access to the data? What are their biggest challenges? The thousands of responses to the survey behind the report offer the answers, and also provide an opportunity to dive deeper and examine those issues at an industry sector level.

Creating Custom Plugins Using The Snap Framework

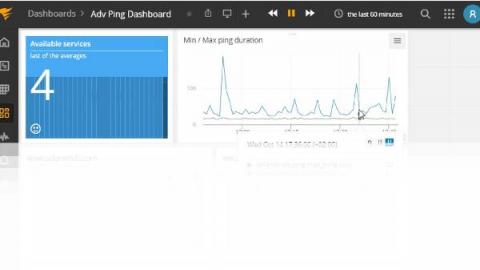
SolarWinds® AppOptics™ was designed from the ground up as a SaaS-based APM tool for cloud-native and traditional IT implementations. It provides out-of-the-box monitoring for applications and infrastructure through simple-to-install APM libraries and host agents. AppOptics makes it easy for multiple teams to quickly assess the health and performance of your applications regardless of how or where they are implemented.

Why Cross-Domain Topology Seems Too Good To Be True

There are some things in life that seem too good to be true. So good, in fact, that they border on the edge of mythology. We see this often in the case of Cross-Domain Topology. Cross-Domain Topology ties together all the pieces of a hybrid, dynamic IT environment, so you can instantly see how changes impact your environment. It’s something that a lot of people didn’t even think was a possibility. While unicorns are myths, Cross-Domain Topology is very real. Here’s how it works.

Icinga 2 Config Language (DSL): Advanced Apply Rules

As many users of Icinga don’t know what the DSL has to offer, I’m going to show you how to use custom variables and apply for rules to make your life easier when writing configuration for your Icinga environment. In this example we will use custom variables on a host to configure a dynamic set of services to monitor multiple web services behind a reverse proxy. On the host we define a custom dictionary called http_vhosts and assign our virtual hosts to it.