Operations | Monitoring | ITSM | DevOps | Cloud

Monitoring

The latest News and Information on Monitoring for Websites, Applications, APIs, Infrastructure, and other technologies.

The Easiest Way to Monitor Node.js: Automatic Instrumentation

Monitoring for your Node.js apps can be hard. The tricky part is understanding what you need to monitor, instrumenting your code, and then making sense of all the data that’s been emitted. (That’s almost every part you might say 😅 ). At AppSignal, we dogfood our product and understand the pain users feel ourselves. The key points we focus on are the ease of use, flexibility, and developer experience.

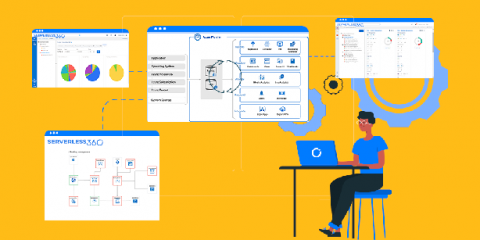
Best Alternatives to Azure Monitor

Due to rapid cloud adoption and with never-ending user requirements, the Azure architecture might become complex and you might eventually lose sight of the overall cloud estate and how it relates to each other. Since the Azure portal was designed in a technology vertical silo and it has near zero application visibility, it is not possible to monitor them as a business application in the Azure portal.

Observability: is it a future of monitoring

As a concept, observability has been a relatively recent entrant into the world of information technology and cloud technology. The idea originated initially from controls system engineering. Observability refers to the concept of inferring the internal status of the system based on the outputs derived from the same. This is the conventional definition of observability.

How to create fast queries with Loki's LogQL to filter terabytes of logs in seconds

LogQL, the Loki query language, is heavily inspired by Prometheus PromQL. However, when it comes to filtering logs and finding the needle in the haystack, the query language is very specific to Loki. In this article we’ll give you all the tips to create fast filter queries that can filter terabytes of data in seconds. In Loki there are three types of filters that you can use.

5 Infrastructure Monitoring Mistakes Your Organization May Be Making

Most organizations know that they need monitoring to ensure site uptime and keep their business running. Yet, many sites still suffer from outages first reported by their customers due to small mistakes made with their monitoring systems. Monitoring mistakes are easy to make and easy to overlook, but the consequences can be detrimental. Here are some of the most common monitoring mistakes and how to address them.

Splunk Named a Leader in The Forrester Wave: Security Analytics Platforms, Q4 2020

We’re thrilled to share the news that Splunk has been named a Leader in The Forrester Wave™: Security Analytics Platforms, Q4 2020. It’s an honor to be named a Leader by Forrester. We view it as an affirmation of our commitment to customer success and a reflection of our ability to understand their needs. Through close collaboration with our customers, we have developed innovative solutions to protect their data hosted in on-premises, hybrid or multi-cloud environments.

Digital Experience Monitoring 101 - Know Your Node

One of the areas highlighted in end-user reviews from Catchpoint’s Gartner Peer Insights Customers’ Choice Distinction was the depth and breadth of visibility our global node network provides. “Any time we have had a question about an element of our environment we have been able to create a Catchpoint test to measure it. The data collected by Catchpoint tests is in-depth and very useful for understanding product behavior and performance.”

Setting Business Goals with SLOs

‘Tis the season to set 2021 goals. Whether setting OKRs, KPIs, KPAs, MBOs, or any other flavor of goal-setting frameworks in an endless sea of acronym soup, chances are that you’re still dealing with a sizable disconnect between business objectives and daily engineering work. Service Level Objectives (SLOs) have boomed in popularity because they provide a common language between business stakeholders and engineers to set aligned goals.