Operations | Monitoring | ITSM | DevOps | Cloud

Monitoring

The latest News and Information on Monitoring for Websites, Applications, APIs, Infrastructure, and other technologies.

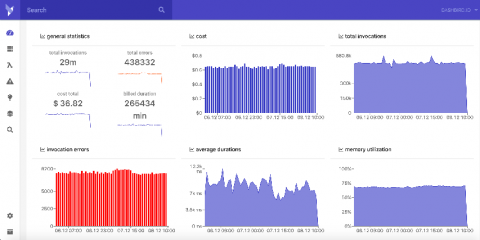
Log-based monitoring for AWS Lambda

Monitoring and analytics have been an issue for Serverless systems since they were invented. While it’s easy to attach an agent like NewRelic or DataDog to a server or container, function monitoring requires a different approach. Serverless applications, where logic is distributed over a large number of functions, attaching agents or wrappers leads to cost increase and development overhead.

Customer Experience and IT Operations at a Healthcare Startup

Dave Widener is CTO of MyHealthMath, a provider of health plan decision support tools which simplify every aspect of open enrollment. Widener is executive leader for the company's entire technology function including R&D, strategic planning, cybersecurity, and technical product execution. Widener’s career encompasses IT management and leadership roles in the energy, life sciences, consumer products and banking sectors.

A Beginner's Guide to Microsoft Power BI & Network Reports

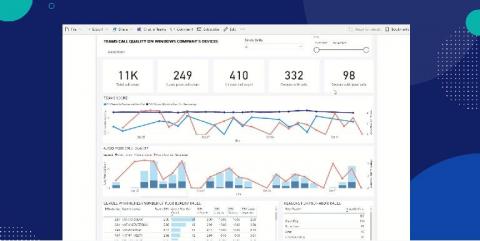
As a network admin or a network manager, you’re likely using a ton of software and tools—from network monitoring tools like Auvik to ITSMs like ServiceNow to communications apps like Microsoft Teams. With a lot of tools comes a lot of data, which can show you how your network and your team are performing over a period of time. The challenge is putting all of those pieces together to see the bigger picture.

Building your modern cloud SIEM

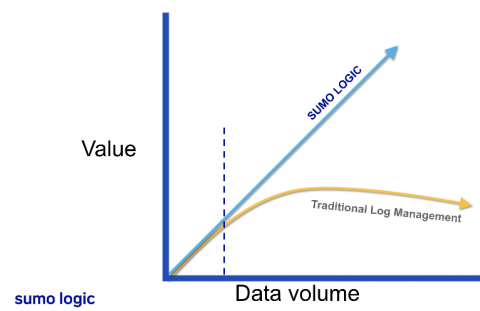
SIEM has traditionally earned itself a bad reputation as an unwieldy and unmanageable tool that really never lived up to its promises. In my presentation during Illuminate, I talked about what Sumo Logic is doing to modernize log analytics and SIEM as a whole. Today, we see that despite how overall technology is accelerating, security always seems to lag behind. In Sumo Logic, we address this head-on.

Exploring New Integration Opportunities with Azure Data Lake and Power BI

From digital transformation to infrastructure optimization, business analytics and data visualization allow IT stakeholders to make sense of complex situations. You can’t improve what you can’t measure, right? More and more, we see IT organizations combining different sources of information to uncover unique insight, allowing them to detect areas of improvement, find new opportunities, optimize processes and gain that competitive edge.

Sponsored Post

The top 13 APM tools in 2020

From increased uptime and improved user experiences to reduced risks and decreased expenses, application performance monitoring provides organizations with several business benefits that enable them to move faster than their competitors and deliver more value to their users. For this reason, it comes as no surprise that the market for application performance monitoring (APM) tools is expected to reach nearly $5 billion in 2020, an impressive uptick from the $2.72 billion the market hauled in during 2014.

Why VPNs on mobile devices are a crucial part of securing access to corporate data

Securing access to business resources has always been of high priority for admins and IT teams. In the wake of the pandemic, workforces are more distributed than ever before, and 76 percent of global office workers state that they would like to work from home even when the pandemic is over.

Debug application issues with APM and Network Performance Monitoring

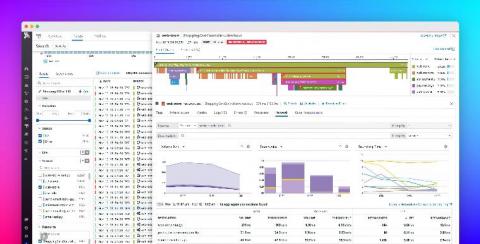
With the advanced containerization that has become the norm in the modern cloud, your infrastructure is likely more distributed, and thus more exposed to networking issues, than ever before. When troubleshooting application performance issues, this can make it difficult to link the symptoms you observe through monitoring the “golden signals” (requests, latency, and errors) on individual endpoints in your application to their underlying root causes.

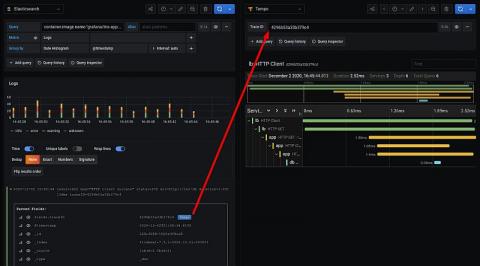
How to find traces in Tempo with Elasticsearch and Grafana

Grafana Tempo, the recently announced distributed tracing backend, relies on integrations with other data sources for trace discovery. Tempo’s job is to store massive amounts of traces, place them in object storage, and retrieve them by ID. Logs and other data sources allow users to quickly and more powerfully jump directly to traces than ever before. Previously we investigated discovering traces with Loki and exemplars.

Support for Database Performance Monitoring in Node

Performance monitoring is great because it lets you see whether your application is fast or slow, and which parts need speeding up. For Node developers, those “parts” are most often endpoints handling incoming requests. Since the introduction of our performance monitoring offering in July 2020, Node devs have been able to use the Sentry SDK, @sentry/node, to measure the total time it takes to process each request, but we made some significant improvements since then.