Operations | Monitoring | ITSM | DevOps | Cloud

Monitoring

The latest News and Information on Monitoring for Websites, Applications, APIs, Infrastructure, and other technologies.

Log Analysis: What Is It and How Does It Work?

If you work in Information Technology, you have doubtless encountered logs- in fact depending on your area of expertise, you may be inundated with them on a daily basis. Nearly every piece of digital technology produces some kind of log, from complex web applications to the drivers that power your mouse and keyboard. As such, the definition of what a “log” actually is, is necessarily loose; any output received from a piece of software could be considered a log.

Network World Case Study on Consolidating Monitoring Tools: How Guardian Life Slashed 70% of License Costs

In a recently published Network World article, "How to Consolidate Network Management Tools," the author wrote about how "enterprise IT shops are getting serious about winnowing the tools they use for network capacity planning, monitoring, event correlation, configuration management and more." In the article, the key problem statement was offered by industry analyst firm EMA: "The problem is that having a patchwork of multiple, siloed tools can be expensive and leads to ‘fragmented workloads, ineffi

Kibana Visualization How-to's: Heatmaps

In Kibana you have a full selection of graphical representations for your data, most of the time this can be a simple line or bar charts to do what you need to do. But every so often you need to take a different view to get the most out of your data. Heatmaps are a critical component of the Kibana visualization arsenal, and deserve their own attention.

AWS Elasticsearch Pricing: Getting Cost Effective Logging as You Scale

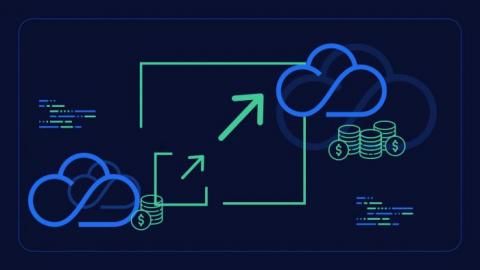
AWS Elasticsearch is a common provider of managed ELK clusters., but does the AWS Elasticsearch pricing really scale? It offers a halfway solution for building it yourself and SaaS. For this, you would expect to see lower costs than a full-blown SaaS solution, however, the story is more complex than that.

Effective Alerting for a Server Monitoring

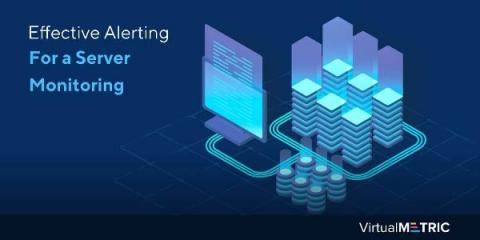
Every minute of server downtime can cost you serious revenue. 98% of organizations revealed that a single hour of downtime costs them over $100,000. The good news is that you can effectively prevent such losses with server monitoring software. Being a critical piece of your technical infrastructure, servers must be continuously tracked for their performance, and health. Efficient server monitoring lets you resolve issues before they become too critical.

Drupal vs. Joomla: Web Performance Compared

Most companies build a resilient system capable of constantly supporting their revenue-generating web applications. However, unforeseen circumstances can occur at any time and cause downtime, making a website unavailable for end users. To ensure a reliable website, it’s important to monitor its availability and performance. Reducing a website’s load time is one of the best ways to provide a seamless user experience.

Troubleshooting Remote End-User Experience with Endpoint Monitoring

In today’s Tip of the Day, we are looking at troubleshooting remote end-user experience using Catchpoint’s Endpoint Monitoring solution. According to a recent set of figures from Stanford University, 42% of the U.S. labor force is working from home full-time. Based on their earnings, this group of work-from-home employees accounts for over two-thirds of U.S. economic activity.

Observability 101: Terminology and Concepts

When I first started following Charity on Twitter back in early 2019, I was quickly overwhelmed by the new words and concepts she was discussing. I liked the results she described: faster debugging, less alert fatigue, happier users. Those are all things I wanted for my team! But I was hung up on these big polysyllabic words, which stopped me from taking those first steps toward improving our own observability.