Operations | Monitoring | ITSM | DevOps | Cloud
Monitoring
The latest News and Information on Monitoring for Websites, Applications, APIs, Infrastructure, and other technologies.
SquaredUp for SCOM - Quick Win Video Series - Part 4: TopN Performance
SquaredUp for SCOM - Quick Win Video Series - Part 5: Dashboard Actions
SquaredUp for SCOM - Quick Win Video Series - Part 6: NOC Dashboard
SquaredUp for SCOM - Quick Win Video Series - Part 7: Using a NOC Dashboard
Jaeger Essentials: Best Practices for Deploying Jaeger on Kubernetes in Production
Logs, metrics and traces are the three pillars of the Observability world. The distributed tracing world, in particular, has seen a lot of innovation in recent months, with OpenTelemetry standardization and with Jaeger open source project graduating from the CNCF incubation. According to the recent DevOps Pulse report, Jaeger is used by over 30% of those practicing distributed tracing.
How to Test Application Availability on Citrix or VMware Horizon
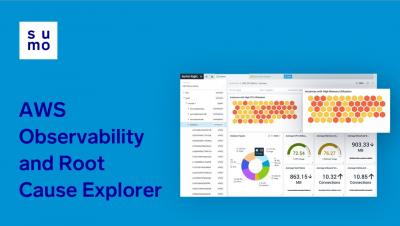
AWS Observability Demo
Node.js Logging: A How-to Guide
When visiting a new website, it is quite normal to get carried away by the bells and whistles of the fancy UI and UX and not be able to appreciate all the lower level, back-end code that runs tirelessly to ensure a smooth and fast website experience. This is because your front-end HTML code has a visually rich browser page interface as a platform to showcase its output. Whereas your back-end, server-side code usually only has a console at its disposal.
Website Benchmarking: An Example on How to Benchmark Performance Against Competitors
Time to first byte, first contentful paint, DNS response time, round-trip time, and the list goes on and on. With all of these metrics, how are you supposed to know which are the most important ones that you should monitor? To understand what those numbers are supposed to look like, you’ll have to get a reference point. Something that’s supposed to give you a starting point.


