Operations | Monitoring | ITSM | DevOps | Cloud

Monitoring

The latest News and Information on Monitoring for Websites, Applications, APIs, Infrastructure, and other technologies.

Netdata Agent v1.24: Prometheus/OpenMetrics collector and multi-host database mode

This release broadens our commitment to open standards, interoperability, and extensibility with a new generic Prometheus collector that works seamlessly with any application that makes its metrics available in the Prometheus/OpenMetrics exposition format, including support for Windows 10 via windows_exporter. Netdata will autodetect over 600 Prometheus endpoints and instantly generate charts with all the exposed metrics, meaningfully visualized.

Tip of the Day - CDN Hit or Miss ?

Understand how your CDN's are performing with regards to the number of Hits or Misses !!! Remember, if a browser requests a piece of content and the CDN has it cached, then it will deliver that content. This is referred to as a cache hit. However, if the content is not available on the Cache Server(s), then the CDN makes the request back to the Origin server, this is classified as a cache miss. You want cache hits, NOT misses

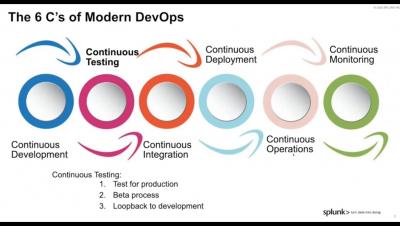
The DevOps Workflow

At the center of DevOps practices is automation and workflow - but what does that actually mean? In this episode of Dissecting DevOps, Dave and Chris talk about the ideal state of DevOps workflows, and why an iterative approach to DevOps processes is critical for the long term success of DevOps practices and principles. Dave McAllister and Chris Riley are DevOps Advocates at Splunk.

JFrog Platform Performance with Datadog Analytics

Faithful operation of your JFrog Platform can be best assured by tracking usage data of Artifactory and Xray. With insights gained through real-time observability and log analytics, you can boost the efficiency of your DevOps pipeline and keep your software releases running joyfully. Datadog is a SaaS-based data analytics platform that is a popularly used monitoring service for cloud-scale applications. It’s a data analysis platform that can be readily enabled for JFrog Platform monitoring through our integrations.

Avoiding Data Deluge and Alarm Fatigue | Netreo On-Demand Webinars

Too many alarms is just as bad as not enough. Getting drowned in data instead of actionable information leads to many missed issues and delayed response times. Not only is the task of triaging redundant and low priority alerts overwhelming, it also has sinister side effects on a Network/System Admin’s work.

Performing Zabbix Alert Correlation and Incident Acceleration with CloudFabrix AIOps

CloudFabrix AIOps 360 solution can ingest alerts, events, metrics and from various monitoring tools to perform event correlation, alert noise reduction and enable incident resolution acceleration. Learn more about CloudFabrix AIOps 360 In this blog I will cover Zabbix integration aspects with our AIOps 360 solution. Zabbix is one of the popular open source monitoring platforms used by many enterprises and MSPs, including some of our customers.

What Can Pandora FMS Offer as a Server Monitoring Tool?

When your server goes down, it can certainly throw a wrench into your daily processes, costing you money and even causing you to lose customers until it’s back up and running again. Thankfully, Pandora FMS can help you prevent it from happening, and in the worst-case scenario when it does, you have the tools to get back up and running again in no time with our server monitoring solution!

How to Create SQL Percentile Aggregates and Rollups With Postgresql and t-digest

When it comes to data, let’s start with the obvious. Averages suck. As developers, we all know that percentiles are much more useful. Metrics like P90, P95, P99 give us a much better indication of how our software is performing. The challenge, historically, is how to track the underlying data and calculate the percentiles. Today I will show you how amazingly easy it is to aggregate and create SQL based percentile rollups with Postgresql and t-digest histograms!

How to "Translate" Grafana Dashboards from Prometheus to Elasticsearch

In the field of open-source metrics and time series monitoring, it is quite clear today that Grafana is the most popular tool of choice. One of Grafana’s main advantages is its storage backend flexibility. It can support almost all the major time series datastores (Prometheus, InfluxDB, Elasticsearch, Graphite etc.), when each datastore has its own query language syntax, and slight differences in the actual Grafana UI and capabilities resulting from these differences.

Mastering the Art of Managing Hybrid and Cloud Environments | Netreo On-Demand Webinars

Moving your applications and infrastructure to the cloud has many challenges, but managing them and maintaining visibility shouldn’t be one of them. 95% of organizations already have a cloud strategy, 81% of organizations use a multi-cloud approach, and 51% of organizations are now using a hybrid-cloud. These transitions to cloud environments add increased complexity that can create significant visibility challenges.